Statistical Significance Guide
Determining Sample Size: How Many Survey Participants Do You Need?

Part III: Sample Size: How Many Participants Do I need for a Survey to be Valid?
In the U.S., there is a Presidential election every four years. In election years, there is a steady stream of polls in the months leading up to the election announcing which candidates are up and which are down in the horse race of popular opinion.
If you have ever wondered what makes these polls accurate and how each poll decides how many voters to talk to, then you have thought like a researcher who seeks to know how many participants they need in order to obtain statistically significant survey results.
Statistically significant results are those in which the researchers have confidence their findings arenot due to chance. Obtaining statistically significant results depends on the researchers' sample size (how many people they gather data from) and the overall size of the population they wish to understand (voters in the U.S., for example).
Calculating sample sizes can be difficult even for expert researchers. Here, we show you how to calculate sample size for a variety of different research designs.
Before jumping into the details, it is worth noting that formal sample size calculations are often based on the premise that researchers are conducting a representative survey with probability-based sampling techniques. Probability-based sampling ensures that every member of the population being studied has an equal chance of participating in the study and respondents are selected at random.
For a variety of reasons, probability sampling is not feasible for most behavioral studies conducted in industry and academia. As a result, we outline the steps required to calculate sample sizes for probability-based surveys and then extend our discussion to calculating sample sizes for non-probability surveys (i.e., controlled samples) and experiments.
How to Calculate a Statistically Significant Sample Size in Research
Determining Sample Size for Probability-Based Surveys and Polling Studies
Determining how many people you need to sample in a survey study can be difficult. How difficult? Look at this formula for sample size.
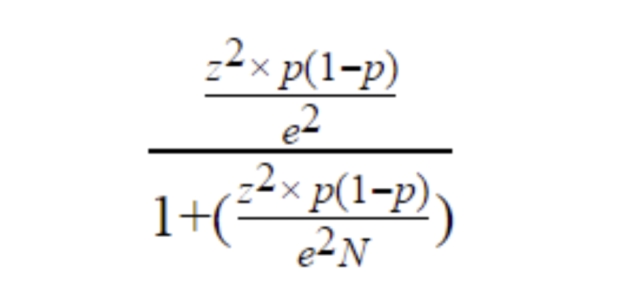
No one wants to work through something like that just to know how many people they should sample. Fortunately, there are several sample size calculators online that simplify knowing how many people to collect data from.
Even if you use a sample size calculator, however, you still need to know some important details about your study. Specifically, you need to know:
- What is the population size in my research?
Population size is the total number of people in the group you are trying to study. If, for example, you were conducting a poll asking U.S. voters about Presidential candidates, then your population of interest would be everyone living in the U.S.—about 330 million people.
Determining the size of the population you're interested in will often require some background research. For instance, if your company sells digital marketing services and you're interested in surveying potential customers, it isn't easy to determine the size of your population. Everyone who is currently engaged in digital marketing may be a potential customer. In situations like these, you can often use industry data or other information to arrive at a reasonable estimate for your population size.
- What margin of error should you use?
Margin of error is a percentage that tells you how much the results from your sample may deviate from the views of the overall population. The smaller your margin of error, the closer your data reflect the opinion of the population at a given confidence level.
Generally speaking, the more people you gather data from the smaller your margin of error. However, because it is almost never feasible to collect data from everyone in the population, some margin of error is necessary in most studies.
- What is your survey's significance level?
The significance level is a percentage that tells you how confident you can be that the true population value lies within your margin of error. So, for example, if you are asking people whether they support a candidate for President, the significance level tells you how likely it is that the level of support for the candidate in the population (i.e., people not in your sample) falls within the margin of error found in your sample.
Common significance levels in survey research are 90%, 95%, and 99%.
Once you know the values above, you can plug them into a sample size formula or more conveniently an online calculator to determine your sample size.
The table below displays the necessary sample size for different sized populations and margin of errors. As you can see, even when a population is large, researchers can often understand the entire group with about 1,000 respondents.
| Population Size | Sample Size Based on ±3% Margin of Error | Sample Size Based on ±5% Margin of Error | Sample Size Based on ±10% Margin of Error |
|---|---|---|---|
| 500 | 345 | 220 | 80 |
| 1,000 | 525 | 285 | 90 |
| 3,000 | 810 | 350 | 100 |
| 5,000 | 910 | 370 | 100 |
| 10,000 | 1,000 | 385 | 100 |
| 100,00+ | 1,100 | 400 | 100 |
- How Many People Should I Invite to My Study?
Sample size calculations tell you how many people you need to complete your survey. What they do not tell you, however, is how many people you need to invite to your survey. To find that number, you need to consider the response rate.
For example, if you are conducting a study of customer satisfaction and you know from previous experience that only about 30% of the people you contact will actually respond to your survey, then you can determine how many people you should invite to the survey to wind up with your desired sample size.
All you have to do is take the number of respondents you need, divide by your expected response rate, and multiple by 100. For example, if you need 500 customers to respond to your survey and you know the response rate is 30%, you should invite about 1,666 people to your study (500/30*100 = 1,666).
Determining Sample Size for Controlled Surveys
Sample size formulas are based on probability sampling techniques—methods that randomly select people from the population to participate in a survey. For most market surveys and academic studies, however, researchers do not use probability sampling methods. Instead they use a mix of convenience and purposive sampling methods that we refer to as controlled sampling.
When surveys and descriptive studies are based on controlled sampling methods, how should researchers calculate sample size?
When the study's aim is to measure the frequency of something or to describe people's behavior, we recommend following the calculations made for probability sampling. This often translates to a sample of about 1,000 to 2,000 people. When a study's aim is to investigate a correlational relationship, however, we recommend sampling between 500 and 1,000 people. More participants in a study will always be better, but these numbers are a useful rule of thumb for researchers seeking to find out how many participants they need to sample.
Determining Sample Size for Experiments
If you look online, you will find many sources with information for calculating sample size when conducting a survey, but fewer resources for calculating sample size when conducting an experiment. Experiments involve randomly assigning people to different conditions and manipulating variables in order to determine a cause-and-effect relationship. The reason why sample size calculators for experiments are hard to find is simple: experiments are complex and sample size calculations depend on several factors.
The guidance we offer here is to help researchers calculate sample size for some of the simplest and most common experimental designs: t-tests, A/B tests, and chi square tests.
How to Calculate Sample Size for Simple Experiments
Many businesses today rely on A/B tests. Especially in the digital environment, A/B tests provide an efficient way to learn what kinds of features, messages, and displays cause people to spend more time or money on a website or an app.
For example, one common use of A/B testing is marketing emails. A marketing manager might create two versions of an email, randomly send one to half the company's customers and randomly send the second to the other half of customers and then measure which email generates more sales.
In many cases, researchers may know they want to conduct an A/B test but be unsure how many people they need in their sample to obtain statistically significant results. In order to begin a sample size calculation, you need to know three things.
1. The significance level.
The significance level represents how sure you want to be that your results are not due to chance. A significance level of .05 is a good starting point, but you may adjust this number up or down depending on the aim of your study.
2. Your desired power.
Statistical tests are only useful when they have enough power to detect an effect if one actually exists. Most researchers aim for 80% power—meaning their tests are sensitive enough to detect an effect 8 out of 10 times if one exists.
3. The minimum effect size you are interested in.
The final piece of information you need is the minimum effect size, or difference between groups, you are interested in. Sometimes there may be a difference between groups, but if the difference is so small that it makes little practical difference to your business, it probably isn't worth investigating.
Determining the minimum effect size you are interested in requires some thought about your goals and the potential impact on your business.
Once you have decided on the factors above, you can use a sample size calculator to determine how many people you need in each of your study's conditions.
An Example Sample Size Calculation for an A/B test
Let's say a marketing team wants to test two different email campaigns. They set their significance level at .05 and their power at 80%. In addition, the team determines that the minimum response rate difference between groups that they are interested in is 7.5%. Plugging these numbers into an effect size calculator reveals that the team needs 693 people in each condition of their study, for a total of 1,386.
Sending an email out to 1,386 people who are already on your contact list doesn't cost too much. But for many other studies, each respondent you recruit will cost money. For this reason, it is important to strongly consider what the minimum effect size of interest is when planning a study.
What if I Don't Know What Size Difference to Expect?
When you don't know what size difference to expect among groups, you can default to one of a few rules of thumb. First, use the effect size of minimum practical significance. By deciding what the minimum difference is between groups that would be meaningful, you can avoid spending resources investigating things that are likely to have little consequences for your business.
A second rule of thumb that is particularly relevant for researchers in academia is to assume an effect size of d = .4. A d = .4 is considered by some to be the smallest effect size that begins to have practical relevance. And fortunately, with this effect size and just two conditions, researchers need about 100 people per condition.
After you know how many people to recruit for your study, the next step is finding your participants. By using CloudResearch's Prime Panels or MTurk Toolkit, you can gain access to more than 50 million people worldwide in addition to user-friendly tools designed to make running your study easy. We can help you find your sample regardless of what your study entails. Need people from a narrow demographic group? Looking to collect data from thousands of people? Do you need people who are willing to engage in a long or complicated study? Our team has the knowledge and expertise to match you with the right group of participants for your study. Get in touch with us today and learn what we can do for you.
Continue Reading: A Researcher's Guide to Statistical Significance and Sample Size Calculations


Related Articles

What Is Data Quality and Why Is It Important?
If you were a researcher studying human behavior 30 years ago, your options for identifying participants for your studies were limited. If you worked at a university, you might be...
Read More
How to Identify and Handle Invalid Responses to Online Surveys
As a researcher, you are aware that planning studies, designing materials and collecting data each take a lot of work. So when you get your hands on a new dataset,..
Read More