Blog
Moving Beyond Bots: MTurk as a Source of High Quality Data

By Leib Litman, PhD, Jonathan Robinson, PhD, Aaron Moss, PhD, & Richa Gautam
Highlights
We collected high quality data on MTurk when using TurkPrime’s IP address and Geocode-restricting tools.
Using a novel format for our anchoring manipulation, we found that Turkers are highly attentive, even under taxing conditions.
After querying the TurkPrime database, we found that farmer activity has significantly decreased over the last month.
When used the right way, researchers can be confident they are collecting quality data on MTurk.
We are continuously monitoring and maintaining data quality on MTurk.
Starting this month, we will be conducting monthly surveys of data quality on Mechanical Turk.
About a month ago, we published After the Bot Scare blog on workers providing bad quality data on Amazon’s Mechanical Turk. This month, we followed up with our “farmers” to assess the effectiveness of the tools we created to deal with the problem. In this blog, we present data from our follow-up study and evidence to suggest our tools are working.
For those who have not followed the conversation about “bots” on MTurk, our previous blog post provides a complete overview.
Data Quality Month 2: Blocking Farmers
Our investigation was almost identical to the one from last month. We ran two studies on MTurk, one in which we used the list of farmers we identified last time (these were workers who had taken 80% or more of their HITs from server farms), and another in which we collected data from a standard MTurk sample (i.e. workers who have greater than a 95% approval rating and more than 100 HITs completed—commonly used qualifications). For the standard MTurk sample, we used our “Block Duplicate IP Addresses,” “Block Suspicious Locations,” and “Block Duplicate Geolocations” tools and excluded workers who took our data quality study last month.
Both HITs paid $2 and were 20 minutes long. We used the same measures (with some minor modifications discussed below), with the same rationale, as last time.
We easily recruited 100 participants for the non-farmer group, but had trouble recruiting enough farmers into our study. The study was open to 408 farmers. Although we aimed for 100 farmers to complete the study, we were only able to collect 55 responses over 4 days. In order to ascertain the reason for low recruitment, we looked at the activity from server farms and the activity of known farmers on our list over the last month. We found that activity from server farms was in steady decline. Between the first half of August and the first half of September, activity from server farms declined by about 80% (we continued to see this decline for the second part of September and the first part of October). This suggests that many farmers who were previously active on MTurk are no longer active on those accounts.
The Survey
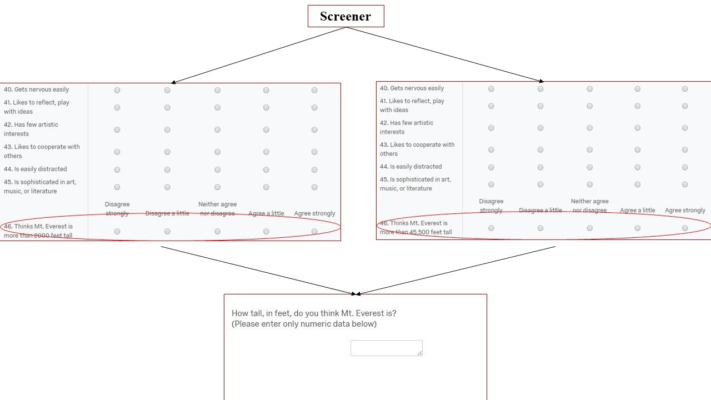
We made one small change in the survey. We embedded the Mt. Everest anchoring manipulation within the Big Five Inventory questions, so that in the midst of personality questions half of the participants were asked if Mt. Everest is more than 2000 feet tall and the other half were asked if they think Mt. Everest is more than 45,500 feet tall. After that page, participants were asked to enter their estimate of the height of Mt. Everest. We made this change because we wanted to see if the anchoring effect would persist if the time between the questions was longer, and if the anchor was embedded in a matrix full of attention-taxing stimuli.
Results
Big Five Inventory
Like last month, farmers had low Cronbach’s alpha scores, showing low reliability across all five factors, while non-farmers had high alphas (see Table 1).
Table 1: Cronbach’s Alpha coefficients for each factor of the BFI, for farmers and non-farmers
| Personality Factor | Farmers | Non-farmers |
|---|---|---|
| Openness | 0.429 | 0.866 |
| Conscientiousness | 0.686 | 0.894 |
| Extraversion | 0.684 | 0.915 |
| Agreeableness | 0.632 | 0.841 |
| Neuroticism | 0.729 | 0.905 |
Using our Squared Discrepancy Procedure (SDP) (Litman, Robinson, & Rosenzweig, 2015), we examined how consistently participants respond to forward and reversed questions (e.g. “I tend to be organized” vs. “I tend to be disorganized”). The measure yields a number, expressed as a percentage, to describe how consistently participants respond to reversed items. In the graph of squared discrepancy scores (Figure 1), we see that around 47% of farmers fall below a score of 75—the clear cutoff for random responding—while only 2% of non-farmers do. This is consistent with our findings from last month.
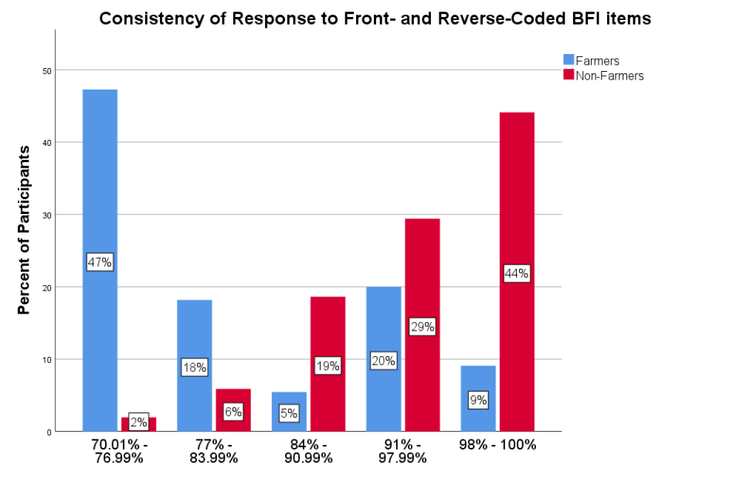
Using the BFI as a measure of attentiveness and internal consistency, we see that data obtained using our tools is of very high quality. This trend was repeated in the other measures as well.
Anchoring Task
Our findings in the anchoring task provide compelling evidence that MTurk participants are very attentive. Remember, the anchoring manipulation was embedded in the BFI among over 50 other questions presented in matrix format (see Figure 2).
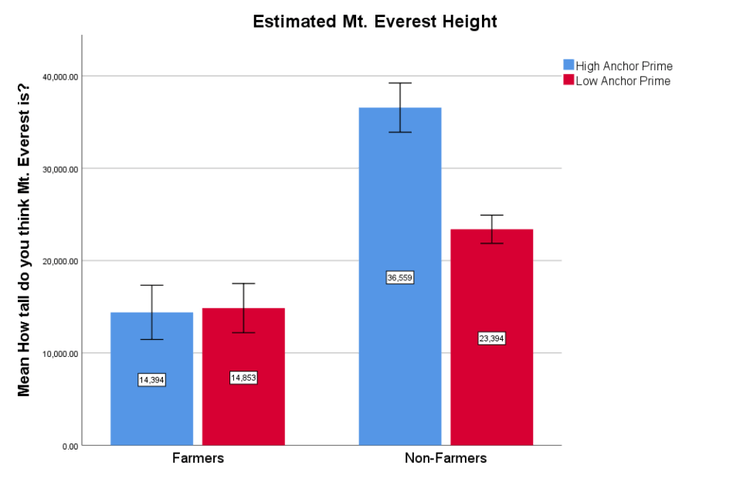
Additionally, participants answered 11 questions after seeing the anchor and before providing their estimate of the height of Mt. Everest. This is a very challenging scenario to investigate anchoring effects in. Still, we see a clear anchoring effect for non-farmers while we see no such effect for farmers (see Figure 3). This shows that the MTurk workers are, as they have always been, high quality participants who pay attention to details.
For the low anchor, most participants in both groups agreed that Mt. Everest is taller than 2,000 feet (see Figure 4). For the high anchor, however, while most of the non-farmers disagreed with Mt. Everest being taller than 45,500 feet, 66% of farmers agreed (either a little or strongly) with the statement (see Figure 5).
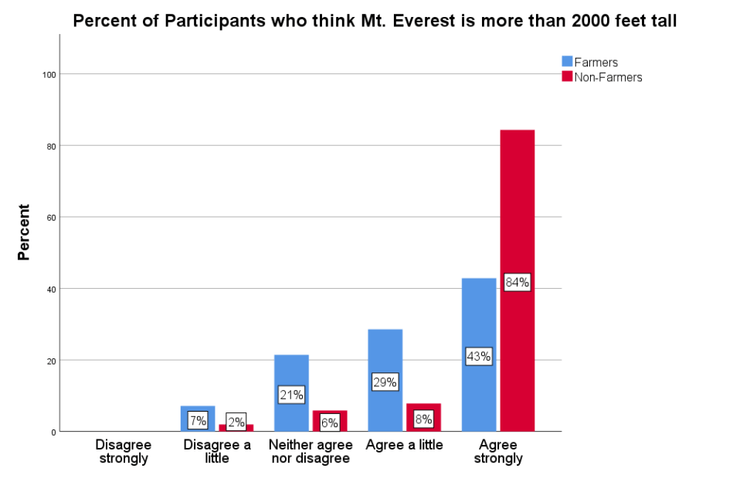
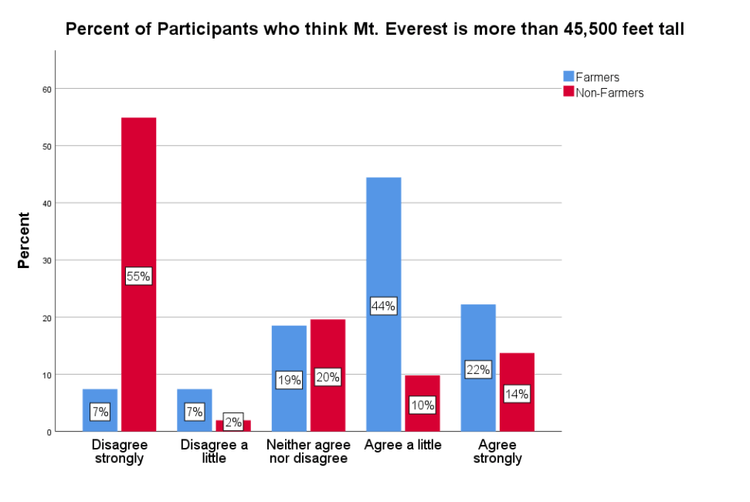
Figures 4 and 5 suggest that MTurk workers are either comprehending the question better or paying more attention when responding.
Trolley Dilemma
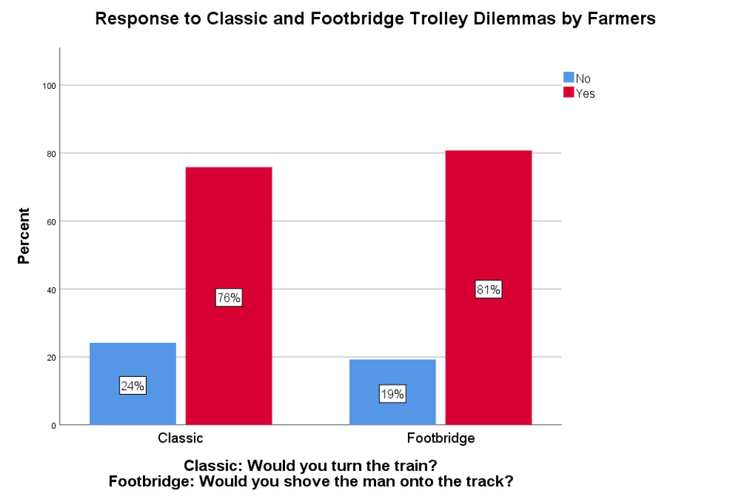
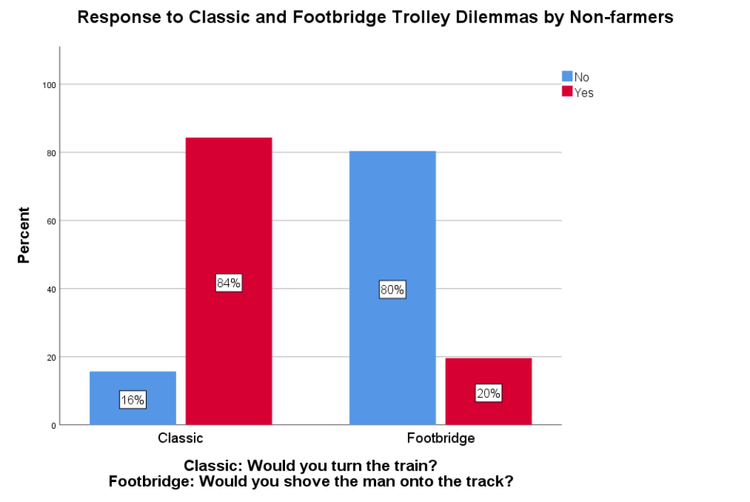
Non-farmers’ responses to the trolley dilemma replicated established findings once again, while farmers did not. Farmers chose to save five people over one person in both scenarios while non-farmers only made that decision when they had to turn the train and not when they had to push a man in front of the train (see Figures 6 and 7).
Open-ended Response
We coded participants’ responses to the open-ended trolley questions (“Please describe the reasons for your response.”) for both conditions of the dilemma.
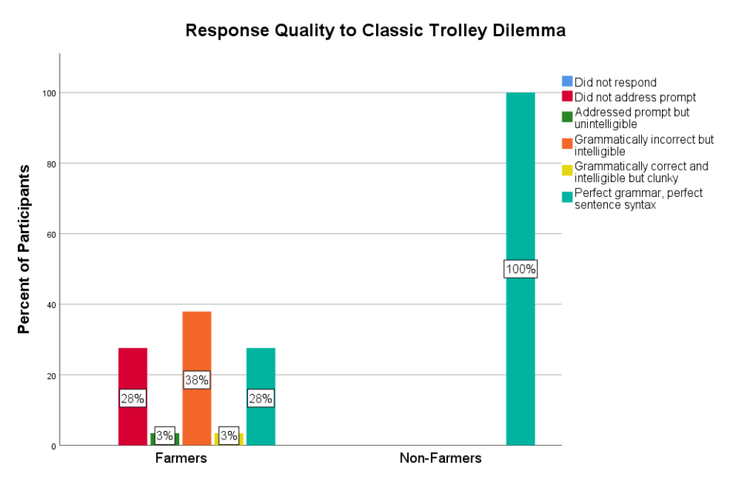
For the classic version, all non-farmers provided high-quality responses while farmers were mixed: some provided good data, some provided acceptable data, and some provided junk (see Figure 8).
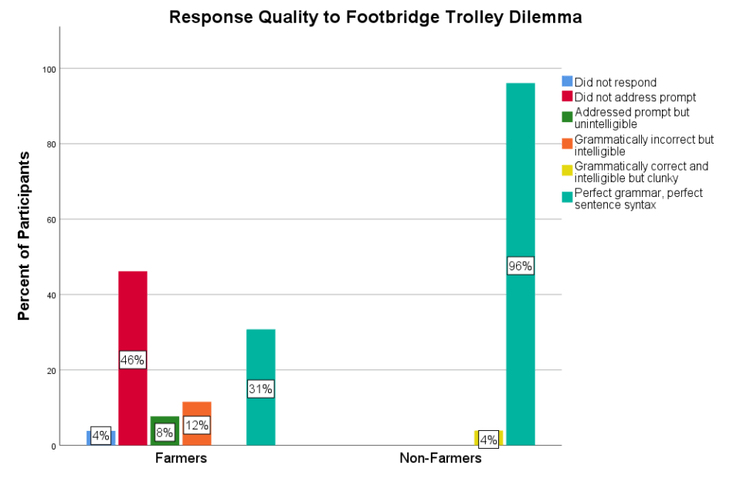
Four percent of farmers in the footbridge version did not respond to the open-ended question. Almost all non-farmers provided high-quality responses while farmers had some good data, some acceptable data, and some junk data (see Figure 9).
Re-Captcha and Honeypot
As last time, all participants passed the re-captcha and honeypot questions, suggesting that these are human beings rather than bots.
English Proficiency Screener
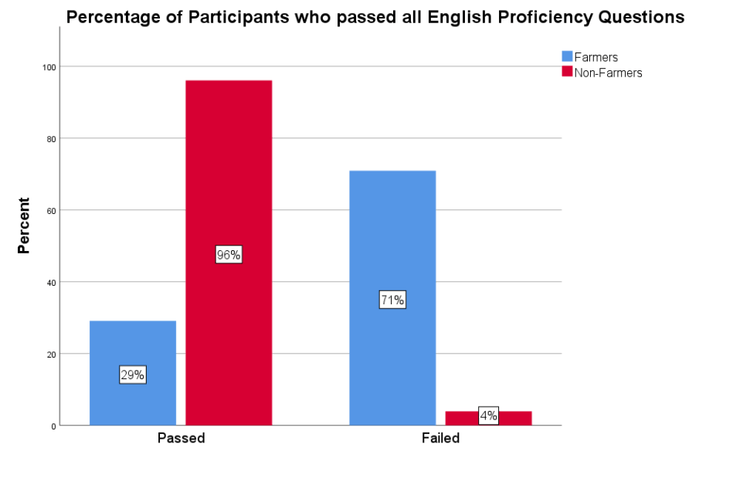
Nearly all non-farmers passed the English proficiency screener, while about 71% of farmers failed (see Figure 10).
Cultural Checks
For our cultural check we kept the questions we used last time. Please note that these questions were open-ended, meaning participants were not choosing from a set of response options.
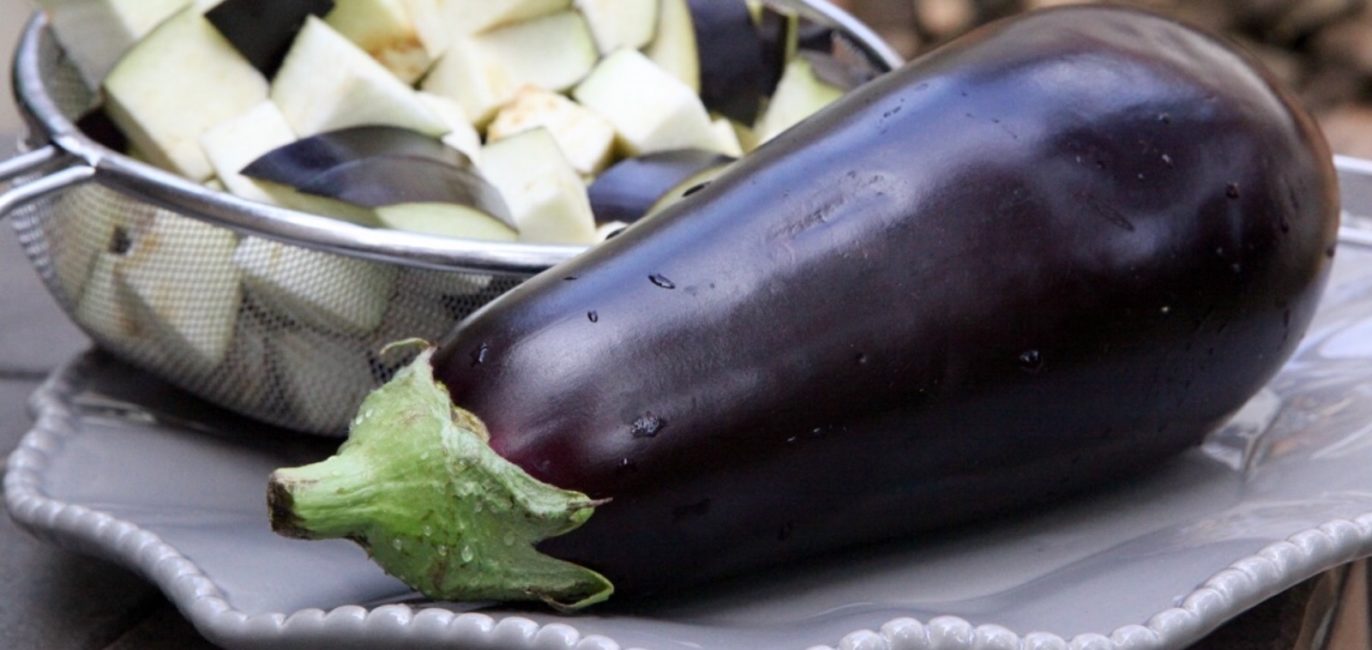
Figure 11. Visual stimulus used for “What is the name of this vegetable?”
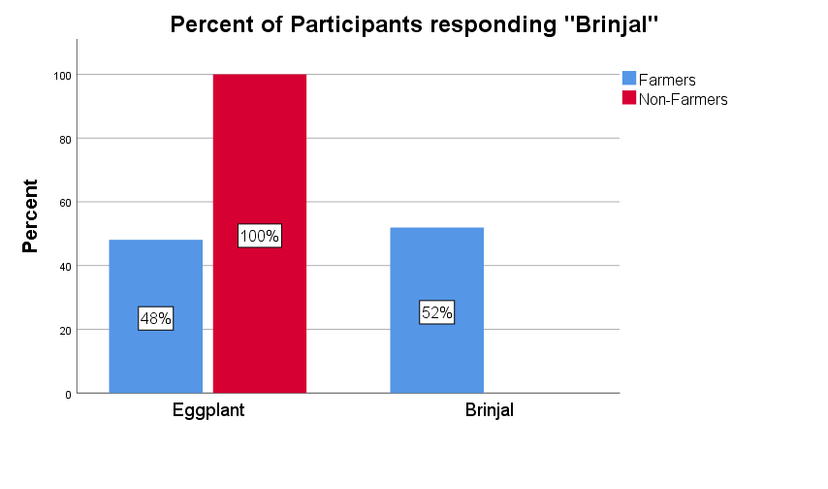
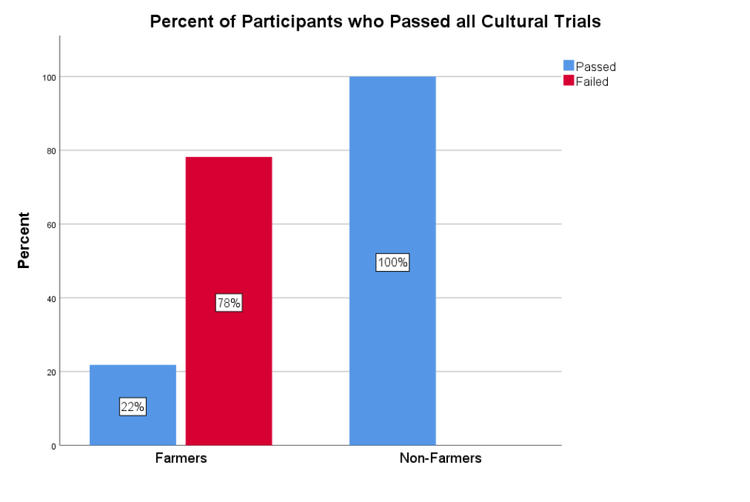
All non-farmers identified the vegetable as an eggplant, while about half of the farmers identified it as brinjal (see Figure 12). All non-farmers passed all four cultural trials while 78% of farmers failed at least one of the four trials (see Figure 13).
Overall Time on the Survey
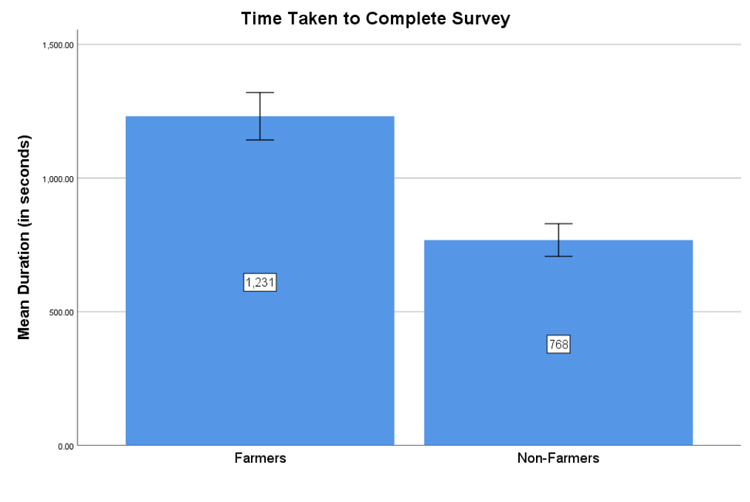
Farmers took about eight minutes longer than non-farmers to complete the survey (see Figure 14). This is consistent with our conclusion last time that farmers are likely people who are either taking a lot of HITs at the same time, or are taking longer to respond to surveys in English.
Summary
Overall, we see that activity from workers who use server farms has decreased. There are, however, some farmers who remain active and as a group they continue to provide mostly random responses. Using TurkPrime’s tools we were able to block farmers from a standard study and obtained high-quality data as a result. Importantly, we did not run a control group without our tools, meaning it is possible there has been an overall decrease in the activity of farmers on MTurk that we could not detect in these studies. Taken together, our results suggest a few things:
- It is possible to collect high quality data using TurkPrime’s tools.
- The most active workers who were providing bad data have reduced their activity on MTurk.
Moving forward
We are monitoring data quality on an ongoing basis, and in the next few weeks we will be sharing more results. We will also continue developing and refining tools to help you collect good, high quality data on Mechanical Turk.
Citation
Litman, L., Robinson, Y., Moss, A.J., Gautam, R. (2018, Oct. 29). Moving beyond bots: MTurk as a source of high quality data [blog post]. Retrieved from /resources/blog/moving-beyond-bots-mturk-as-a-source-of-high-quality-data/
Related Articles

Understanding Turkers: How Do Gig Economy Workers Use Amazon's Mechanical Turk?
By now, most people have heard of the gig economy and have some idea of how it works. In the gig economy, people perform short-term jobs or tasks to earn...
Read More
How to Award a Bonus to MTurk Workers Using CloudResearch
One feature of Mechanical Turk is the ability of researchers to give workers bonus payments. Bonuses may be issued for various reasons such as exemplary performance on a task, answering...
Read More