Escape from Bubble Hell: What Participants Wish Researchers Knew About Survey Design

In this post:
- The survey design mistake that frustrates participants most
- Why the easiest programming choice often produces the worst experience
- How decades of survey methodology research can improve your studies
- Practical guidance on scales, formatting, and mobile optimization
Online survey takers have a name for the thing they hate most. The term comes from a 2023 study that interviewed participants about what made some surveys painful to complete. While public conversation had suggested numerous candidates (Semuels, 2018; cf. Moss et al., 2023), participants complained most about pages of tiny circles and row after row of nearly identical questions (Figure 1). They called it bubble hell.
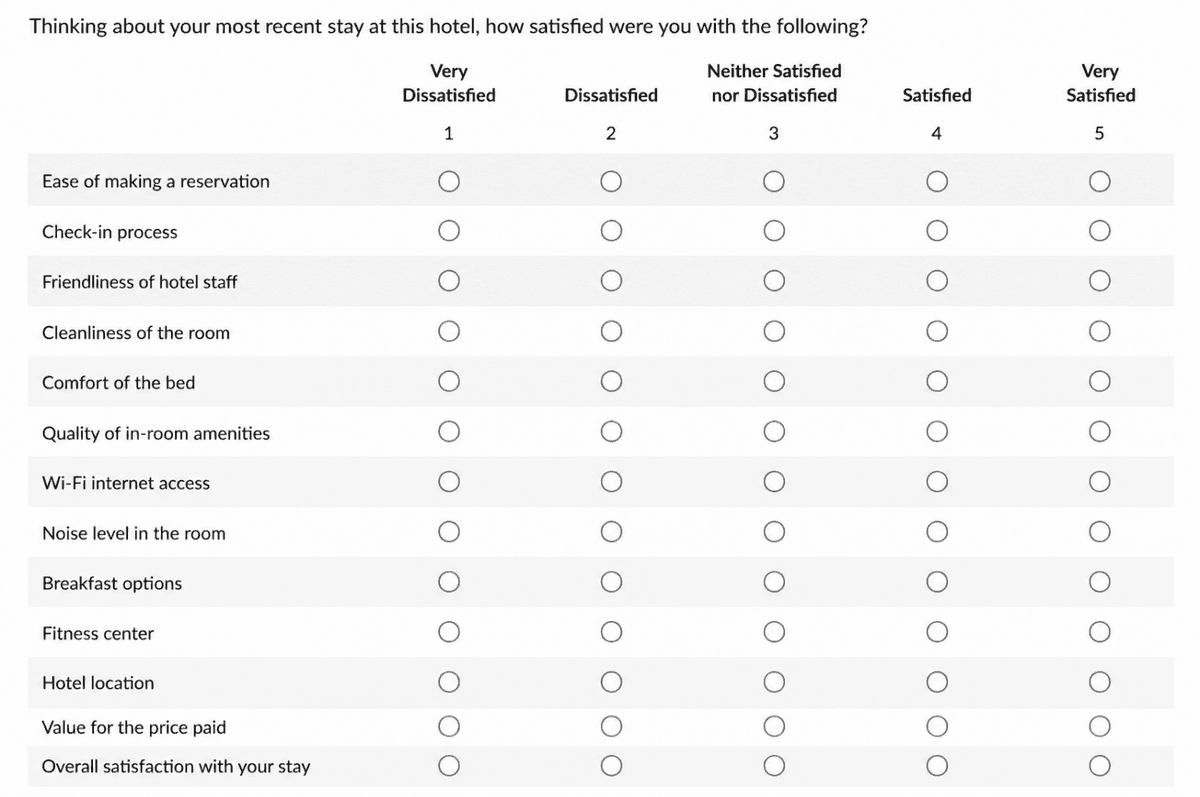
If you’ve ever taken an online survey, you’ve probably experienced this. And if you’ve ever designed a survey, you may have put participants through bubble hell without realizing it. The question is: why does it matter?
When participants get frustrated, they provide worse data. They start clicking random answers, spend less time reading, or drop out entirely, leaving you with incomplete data. It’s also simply unpleasant for them.
The good news is that improving participants’ experience is straightforward. Decades of research on survey methodology have identified what works and what doesn’t in survey design, including how best to present items on a Likert scale. The bad news is that most researchers never learn this material—to the dismay of survey takers everywhere.
What is good survey design?
Good survey design creates a positive experience for participants while collecting high-quality data. It involves choosing appropriate question formats, response scales, and page layouts based on empirical research, not intuition or software defaults. Well-designed surveys reduce participant frustration, minimize dropouts, and produce more reliable responses.
Chapter 13 of Research in the Cloud teaches researchers how to design surveys that treat participants well, engage them in the research process, and respect their time. The focus is on survey design best practices not just because better surveys are nicer to take (although they are), but because they produce better data.
Why Researchers Create Bubble Hell
To understand bubble hell, it helps to know why researchers create it in the first place.
Imagine you’re building a survey with a 44-item personality measure; the Big Five Inventory, say. You have choices in how to display the questions. You could place all 44 items on a single page in a neat grid with response options across the top. You could spread them across multiple pages, showing three or four items at a time. You could present one item per page.
The single-page matrix is the easiest to build. You add statements to the same question block. Sometimes you can upload or copy-paste the items instead of programming each one with page breaks. And some research suggests that presenting items together improves scale reliability.
But with 44 rows and 7 columns, you’ve created 308 tiny bubbles on one screen. You’ve built bubble hell.
The problem becomes clear when you consider the participant’s experience. On a laptop, they’ll scroll to see all the questions, affecting how carefully they read. On a phone, the matrix may be nearly unusable, with cramped text and bubbles too small to tap accurately. By the twentieth row, participants may be clicking without reading.
What’s a better way to present questions? Fortunately, we can do more than guess.
Digging Into the Research on Survey Methodology
Survey methodology is a field with answers to questions about survey design, but unfortunately it occupies an unusual space.
The people who study survey design are often methodologists, statisticians, or researchers at polling organizations. They’re rarely the psychologists, sociologists, or marketing researchers who actually build surveys every day. The result is a strange disconnect: decades of experimental research on question formatting, response scales, and page layouts exists, but it rarely reaches the people who design studies for a living.
The literature doesn’t help. With so many variables tested across different populations, platforms, and eras, the findings can be hard to synthesize. What worked on a mobile device in 2013 may not apply in 2026. What matters for political polling may not matter for consumer research.
Chapter 13 of Research in the Cloud aims to bring clarity. We’ve extracted the findings most relevant to online behavioral research and translated them into practical guidance: what the evidence actually says about response scales, matrix questions, mobile optimization, and more.
What You’ll Learn in Chapter 13
Chapter 13 provides a guide to survey design grounded in empirical research, not intuition.
You’ll learn how to choose between matrix questions and standalone items, how many response options to include on a Likert scale, whether to offer a neutral midpoint, which direction scales should run, and when open-ended questions are worth the effort. For instance, researchers have tested whether scales should have five, seven, or eleven options. The answer is more consistent than you’d expect, and not what most researchers assume.
You’ll also learn how to organize content into blocks, implement randomization and branching, and design surveys that work on mobile devices.
Throughout, the chapter emphasizes a simple principle: design choices that seem minor from the researcher’s perspective can shape how participants engage with your study. Getting these details right isn’t just about being nice. It’s about collecting data that accurately reflects what people think and feel.
Your participants are doing you a favor in taking the study. Chapter 13 helps you return it.
This post is part of a series exploring the chapters of Research in the Cloud: An Introduction to Modern Methods in Behavioral Science by Aaron Moss, Jonathan Robinson, and Leib Litman. Explore Chapter 13 here.