Worse Off Than a Year Ago: New Yorkers Explain Their Economic Pessimism in a New CloudResearch and Siena Study

Note: The results described in this post are exploratory and are not part of any final data released by the Siena Research Institute. Quotes appear verbatim, as respondents typed them.
A majority of New Yorkers in a new exploratory study say they are worse off financially than they were a year ago. This time, they also told us why, in their own words.
Last July, we wrote about a new era in New York State polling: a statewide economic survey in which the Siena Research Institute paired its traditional polling with AI-assisted, in-depth interviews conducted at scale on CloudResearch’s Engage platform. In that first wave, the open-ended interviews helped explain results that the poll numbers alone could not.
This month, the collaboration took its next step. In July 2026, New Yorkers were invited by text message to complete the full Index of Consumer Sentiment (ICS), the same battery of questions behind Siena’s official quarterly consumer sentiment releases, administered entirely inside an Engage interview. After each block of ICS questions, an AI interviewer asked respondents to explain their answers and followed up naturally, producing short conversations rather than one-line responses. Eighty adult New Yorkers from 28 counties completed the interview, which took about 10 minutes on average.
The survey produced both kinds of evidence: the closed-ended items tell us what New Yorkers think, and the interviews tell us why. All of the findings are in the complete report.
What the Numbers Show
The overall mood is negative:
- 54% say they are worse off financially than a year ago; only 15% say better off.
- 56% expect bad times for New York State business conditions over the next 12 months; just 9% expect good times.
- 59% call this a bad time to buy major household items; only 4% call it a good time.
Party differences run in opposite directions for personal and state outlooks. Republicans in this cohort are more likely than Democrats to expect their own finances to improve over the coming year (32% vs. 3%), yet they are also the most likely to expect bad times for New York State over the next five years (74% vs. 34% of Democrats). Democrats show the reverse. They are more pessimistic about their own finances but less pessimistic about the state’s long-term outlook.
The “Why” Behind the Numbers
Asked the main reason they feel the way they do, respondents pointed most often to two things: the rising cost of living (41%) and political leadership (41%).
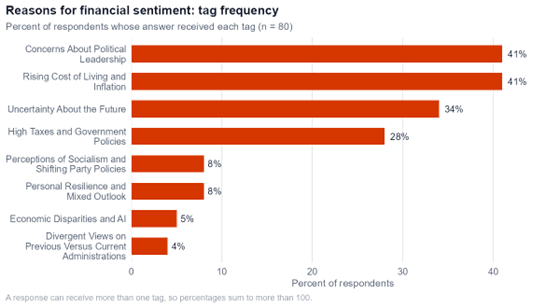
Respondents who talked about the cost of living listed groceries, energy bills, insurance, tuition, and rent, all rising while incomes stay flat:
“I’m making the same money as I did years ago but the cost of living and everything else has gone up 200%. Everyone I know is struggling financially and people are anxious about their future and angry that politicians don’t listen to their desperate pleas for help!!!” 45-year-old woman, $100K+
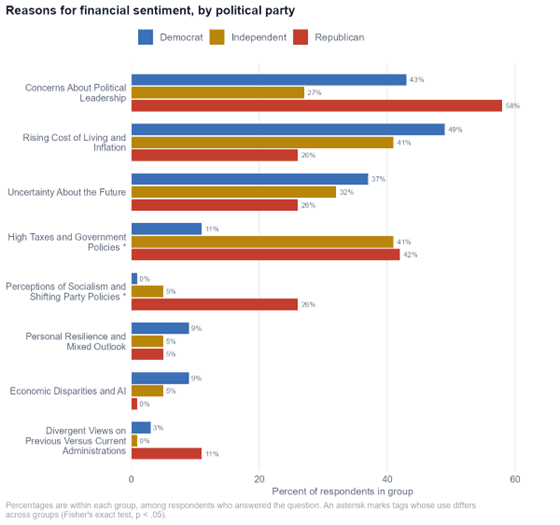
Democrats and Republicans blamed political leaders at statistically similar rates, but they tended to name different leaders. Democrats pointed to President Trump and the federal administration, while Republicans more often named Governor Hochul and Albany:
“Donald Trump is the root cause of everything bad in this state and country. He is bleeding the normal everyday people dry with his thievery.” 67-year-old Democrat, man, $50K-$100K
“Unless you are one of Gov Hochal (sic) cronies you will be worse off. She needs to listen to the people and the President. She is the reason people are leaving which in turn is making it harder for the ones who can’t afford to leave or afford to stay.” 58-year-old Republican, man, under $50K
Some explanations did divide sharply by party. Complaints about high taxes and government policy came from 42% of Republicans and 41% of independents, but only 11% of Democrats. References to socialism or shifting party policies came almost entirely from Republicans.
Few Plans to Buy
Few respondents plan big-ticket purchases in the next six months. Electronics top the list at 24%, and only one respondent plans to buy a home. The reasons differ by income: among respondents earning under $50,000, 71% described personal financial constraints behind their purchase plans, compared with 22% of those earning $100,000 or more.
“We are living paycheck to paycheck, god forbid something happens to our vehicle or to our home. We would just go further in debt.” 58-year-old Republican, man, under $50K
The purchases that are planned are mostly replacements: a broken appliance, a car lost to a recall, a laptop needed for college. A separate group, all Republicans and independents, said they are putting off purchases because they plan to leave New York first.
The Costs That Hit Hardest
Housing (78%), food (75%), and utilities (75%) are the costs respondents most often rated as serious.
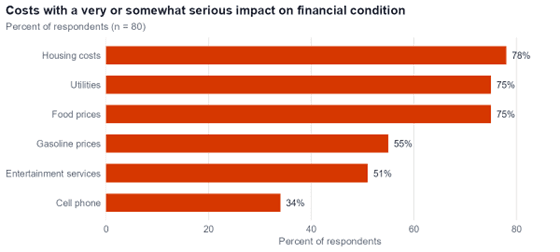
Asked which cost weighs on them most, respondents named utilities more than any single item. Many said their bills keep rising with no explanation, even when they cut back on usage:
“Utilities. National Grid just passed along a 27% increase to the monthly budget plan.” 69-year-old Independent, woman, $50K-$100K
These ratings also differ by group. Gasoline splits by party: 74% of Democrats who rated it called it serious, compared with 26% of Republicans. Cell phone costs split by income: 86% of respondents earning under $50,000 called them serious, compared with 24% of those earning $100,000 or more. No measure in the study, quantitative or qualitative, showed a significant difference between men and women.
What the Interviews Add
Sentiment indexes show which way public mood is moving. The interviews show what is driving it. Respondents in this study tied their ratings to specific bills and leaders, and to their fears about what comes next. That level of detail is hard to get from closed-ended questions alone.
About the Study
Between July 2 and July 6, 2026, 80 adult New York State residents completed the survey after receiving a text message invitation. Interviews ran on CloudResearch’s Engage platform, which administered the closed-ended ICS items and conducted conversational follow-ups on three open-ended probes. Respondents came from 28 counties across the state. The sample skews older, higher income, and more educated than New York State’s adult population, which is common for opt-in text-to-web samples, and results are unweighted.