Beyond Leprechauns: A Smarter Approach to Data Quality in Online Research

In this post:
- Why the attention checks researchers copy from published papers are rarely subjected to quality control themselves, and what that means for your data
- What benchmark validation is, and how it confirms your attention checks actually work
- Why data quality exists on a spectrum
- How a fit-for-purpose framework helps you calibrate screening thresholds to match your specific research goals
- Practical guidelines for how many attention checks to include in a typical study, and how to pair them with open-ended validation
Have you ever had a fatal heart attack while watching TV? Are you paid bi-weekly by leprechauns? Do you swim across the Atlantic Ocean to get to work? These are some of the unusual questions social and behavioral scientists have used to measure attention in online surveys.
Attention checks, also called trap questions or quality control items, are survey questions designed to identify participants who aren’t reading carefully or are providing random responses. The logic behind these questions is simple. Researchers think, If I include a question with an obvious answer, I can confidently remove anyone who gets it wrong for failing to pay attention.
But, how do researchers know if these questions work?
The Problem with a “Good Enough” Approach to Attention Checks
Within the world of online survey research, nearly everyone agrees that attention check questions matter. Most researchers use them to catch fraud and inattention. Yet few people ever validate whether these questions do what they’re supposed to do. This creates an odd status quo.
Often, researchers copy the attention checks they see in published papers, invent their own items, or grab a trick question, logic puzzle, or other item that seems like it should measure data quality. The result is a set of practices that are technically about quality control but are rarely subjected to quality control themselves.
Researchers have found that some participants see the same attention check questions so often that they become easy to pass even when people do not necessarily provide quality data throughout the entire survey (Chandler et al., 2014). In other cases, the questions are entirely ineffective because there are no differences between the people who pass and fail the items on any of the study’s other measures. This means researchers may sometimes catch participants who provide bad data or engage in fraud, but they cannot be confident they are catching all or even most of the threats to data quality. And fraudulent and inattentive participants are exactly the people researchers need to remove from datasets.
How Do You Know if an Attention Check Worked?
There are a few ways to know if an attention check item works, including benchmark validation (Reavey et al., 2025).
Benchmark validation compares survey responses to known population base rates. If participants who fail attention checks report implausibly high rates of rare behaviors, while participants who pass report rates matching the general population, then researchers can be confident the attention checks are identifying the right people.
For example, consider these questions: Do you own a Tesla?; Have you gone scuba diving in the past twelve months?; Do you follow a vegetarian diet? In 2023, less than 5% of Americans could say yes to any of these items, and the cumulative percentage saying yes to all three was below 7%.
Now imagine you’ve given participants four attention checks designed to catch yea-saying, the tendency of fraudulent or inattentive participants to agree with almost everything. You flag everyone who failed two or more of these checks as unreliable.
If your attention checks are working, you’d expect a difference between groups on the benchmark questions. That is, if the people who fail the attention checks truly are not paying attention, they should report implausibly high rates of owning a Tesla, going scuba diving in the last year, and eating a vegetarian diet. People who pass these attention checks, meanwhile, should report rates closer to the population values.
And that’s exactly what the data show. In a study examining data quality across multiple platforms (Reavey et al., 2025), participants flagged as unreliable reported rates of rare behaviors forty to fifty times higher than population base rates (Figure 1). Among participants who passed the attention checks, the numbers were close to the general population.
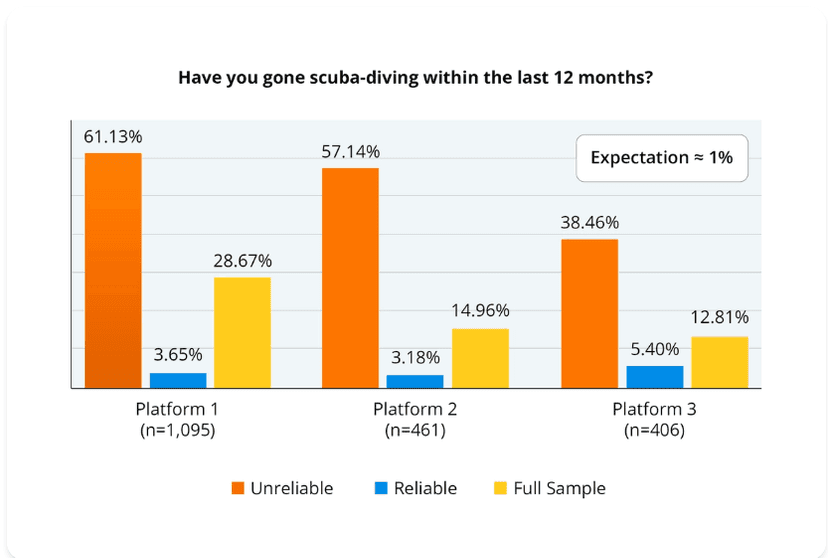
This is the kind of evidence required to validate attention check questions.
Data Quality Exists on a Spectrum
Let’s say you have validated a set of attention check questions. You plan to conduct an online study. How many attention checks should you add to your survey, and where do you draw the line when excluding participants for not paying attention?
Neither of these questions has a direct answer, because data quality does not exist in the categories of “good” and “bad.” Instead, it exists on a spectrum.
Some participants are systematically fraudulent, failing every check, racing through the survey, providing nonsense responses. Others are genuinely engaged but make mistakes: they misread a question, click the wrong button, or lose focus for a moment in an otherwise careful response. Still other participants fall somewhere in between, perhaps starting strong but drifting as the survey goes on.
If you set a lenient threshold (say, removing only participants who failed three or more attention checks) you’ll keep more of the sample, but also retain some unreliable data. If you set a stringent threshold (removing anyone who failed even a single check) you’ll get cleaner data, but you’ll also increase the risk of false positives, discarding good participants who made one honest mistake.
Which threshold is right?
The answer depends on what you’re trying to learn.
A Fit-for-Purpose Approach to Data Quality
Nearly every decision in research comes with trade-offs, and that is true with data quality. As a result, it is best to think through these trade offs with a fit-for-purpose framework.
In this context, a fit-for-purpose approach means understanding that different research questions require different levels of data quality. In a correlational study, for instance, researchers can often tolerate a small amount of noise because a few inattentive participants won’t dramatically change a correlation coefficient, especially in a large sample. This may mean the researcher adopts a moderate threshold, such as removing participants who failed two or more attention checks, to balance data quality and sample retention.
But descriptive research is different. When the goal is to estimate how many people engage in a particular behavior, even a small percentage of unreliable responses can dramatically skew the results. This is exactly what happened with a study the CDC published on dangerous cleaning practices during the COVID-19 pandemic. Without strict quality controls, the researchers concluded that millions of Americans were drinking bleach. With proper screening, the finding disappeared.
For descriptive research, and especially for research on rare behaviors, you need a more stringent threshold. You might require participants to pass all of your attention checks. And you might add an additional layer of validation, such as asking participants who report rare behaviors to describe their experience in their own words, checking whether their open-ended responses confirm or contradict their multiple-choice answers.
The point is that data quality decisions shouldn’t be one-size-fits-all. They should be calibrated to your research goals. A fit-for-purpose approach asks: what level of data quality does this particular study require? And it adjusts the screening strategy accordingly.
What You’ll Learn in Chapter 11
Chapter 11 of Research in the Cloud provides a practical framework for implementing a fit-for-purpose approach to data quality in online research studies.
You’ll learn how to design attention checks that catch participants engaged in yea-saying, see how to validate your checks with benchmark questions, and learn how to choose an appropriate exclusion threshold based on your research objectives.
The chapter walks through an extended example from a large-scale study, showing exactly how these techniques work in practice. You’ll see the data: how participants who fail attention checks respond to benchmark questions, how the numbers shift as you apply more stringent thresholds, and how the data gradually aligns with population parameters as unreliable participants are removed.
You’ll also learn practical guidelines for implementation. For a typical 10-15 minute study, including four or five attention checks plus one open-ended item provides a solid foundation for quality control. By the end of the chapter, you’ll have a validated, calibrated approach to data quality, one that goes beyond gut feeling and good intentions to provide actual evidence that your screening worked. Because your data deserves better than leprechauns.
This post is part of a series exploring the chapters of Research in the Cloud: An Introduction to Modern Methods in Behavioral Science by Aaron Moss, Jonathan Robinson, and Leib Litman. Explore Chapter 11 here.