


Best Practices for Designing a Study
Learn how to design effective online surveys and experiments

Introduction
This book is about online research but, for a moment, we want you to think about offline research.
Imagine you need to conduct a study, but modern technology is not available. Participants cannot use computers to answer questions or complete tasks that measure reaction time. You cannot use tablets or mobile devices for games, website testing, or tracking behavior. Your study is limited to what you can observe or measure while in the same space as participants. What can you do?
In the past, behavioral scientists used these situations to observe people's behavior, record their conversations, and measure just about every psychological construct that can be measured with paper questionnaires. This requires a lot of work.
First, a researcher must create questions (and ideally go through the steps of validation outlined in Chapter 4). Then, they must format those questions into a document and make copies. If the study includes different versions or varies the order of questions, the researcher must prepare multiple versions and give each participant the correct one. After participants complete the questions, their responses must be transferred to a computer, which is a slow process prone to error.
Now, compare this with online surveys. When creating digital surveys, researchers can choose from different question types and control how they appear. The digital format allows for interactive, flexible, and personalized materials. If the study requires participants to watch a video, view an image, listen to audio, or read a scenario, the researcher can easily present these materials. They can also change the order of questions based on people's previous answers, guide participants down different paths in the study, and remind participants of their previous responses before asking new questions. The survey tool automatically records people's responses and can even collect information about the participant's device or browser. Simply put, online surveys offer more possibilities with less effort than paper ones.
In this chapter, we will explore how to design online studies. If you read Part I or if you have used survey tools before, the information at the start of this chapter may be familiar to you. For example, in Module 13.1 we will learn about two foundational parts of online survey platforms: survey elements and question blocks. But regardless of your experience with survey platforms, this chapter will extend your knowledge by describing how to best program online surveys and summarize what research has to say on how participants respond to different aspects of an online study. We will learn about those details in Module 13.2.
By the end of this chapter, we will understand the potential and flexibility of online survey platforms; the different types of questions that can be presented to participants; the essential skills for programming surveys and experiments and customizing online studies; and how to make design choices that align with the goals of a research study.
Chapter Outline
Understanding Survey Platforms and Their Features
Learn the basics of survey platforms and how they operate
What is a Survey Platform?
If you have never used a survey platform, think of it as a digital toolbox that allows users to create customized questionnaires, distribute projects, and collect data efficiently.
Survey platforms have transformed data collection in the behavioral sciences by making powerful tools accessible to anyone who can use a point-and-click interface. For most studies, no technical knowledge or advanced programming skills are required. Beyond creating projects, many platforms include basic data analysis tools that help users identify patterns through simple visualizations and descriptive statistics. Yet despite their sophisticated features, survey platforms serve a straightforward purpose: they allow researchers to ask questions and gather responses.
For simplicity, we refer to all materials presented to participants within an online study—instructions, consent forms, individual questions, experimental manipulations, etc.—as "survey elements." These elements form the basic building blocks of a study. To show the range of these elements, we will walk through a study about consumer reactions to a new product. This example demonstrates how some survey elements recreate traditional offline questions while others introduce new ways to collect data.
Another important concept within online surveys involves what are known as blocks. Blocks are how researchers organize elements. Blocks give online researchers the flexibility to do things that are either difficult or impossible offline. For example, blocks make it possible to randomize content and create branching logic—features that customize each participant's experience in the survey. To show how powerful blocks can be, we will revisit the study we introduced in Chapter 4 examining the relationship between anxiety and depression.
Finding a Survey Platform
Survey platforms are abundant, yet when it comes to selecting the right platform for your project, you should consider what participants need to do and how many responses you plan to collect. At minimum, your chosen platform should provide tools to design your study, distribute the project, and securely store participant data.
Your first step should be checking whether your institution has an existing subscription. Many colleges and universities subscribe to Qualtrics or similar services. If you do not have access through a subscription, Qualtrics offers a free version for a limited number of responses. In addition, CloudResearch's Engage platform is free to use with this book. Finally, while not as powerful as Qualtrics or Engage, Google Forms allows unlimited responses and works well for straightforward projects. Other common platforms include Alchemer, RedCap, Gorilla, SurveyMonkey, and QuestionPro.
Survey Elements
Survey elements typically vary throughout a project. At the beginning, researchers often present study information and consent forms. In the middle, they might embed videos, scenarios, images, or audio recordings and collect participants' responses to various questions. At the end, researchers frequently ask demographic questions, provide debriefing information or direct participants to helpful resources. While the beginning and ending portions are usually informational, the middle section contains the core research activities.
To demonstrate the range of survey elements available in online research, we are going to describe a project that the authors of this book conducted for a company called SpongeBath. While we talk about SpongeBath, this is not an advertisement. We have no financial interest in promoting the company.
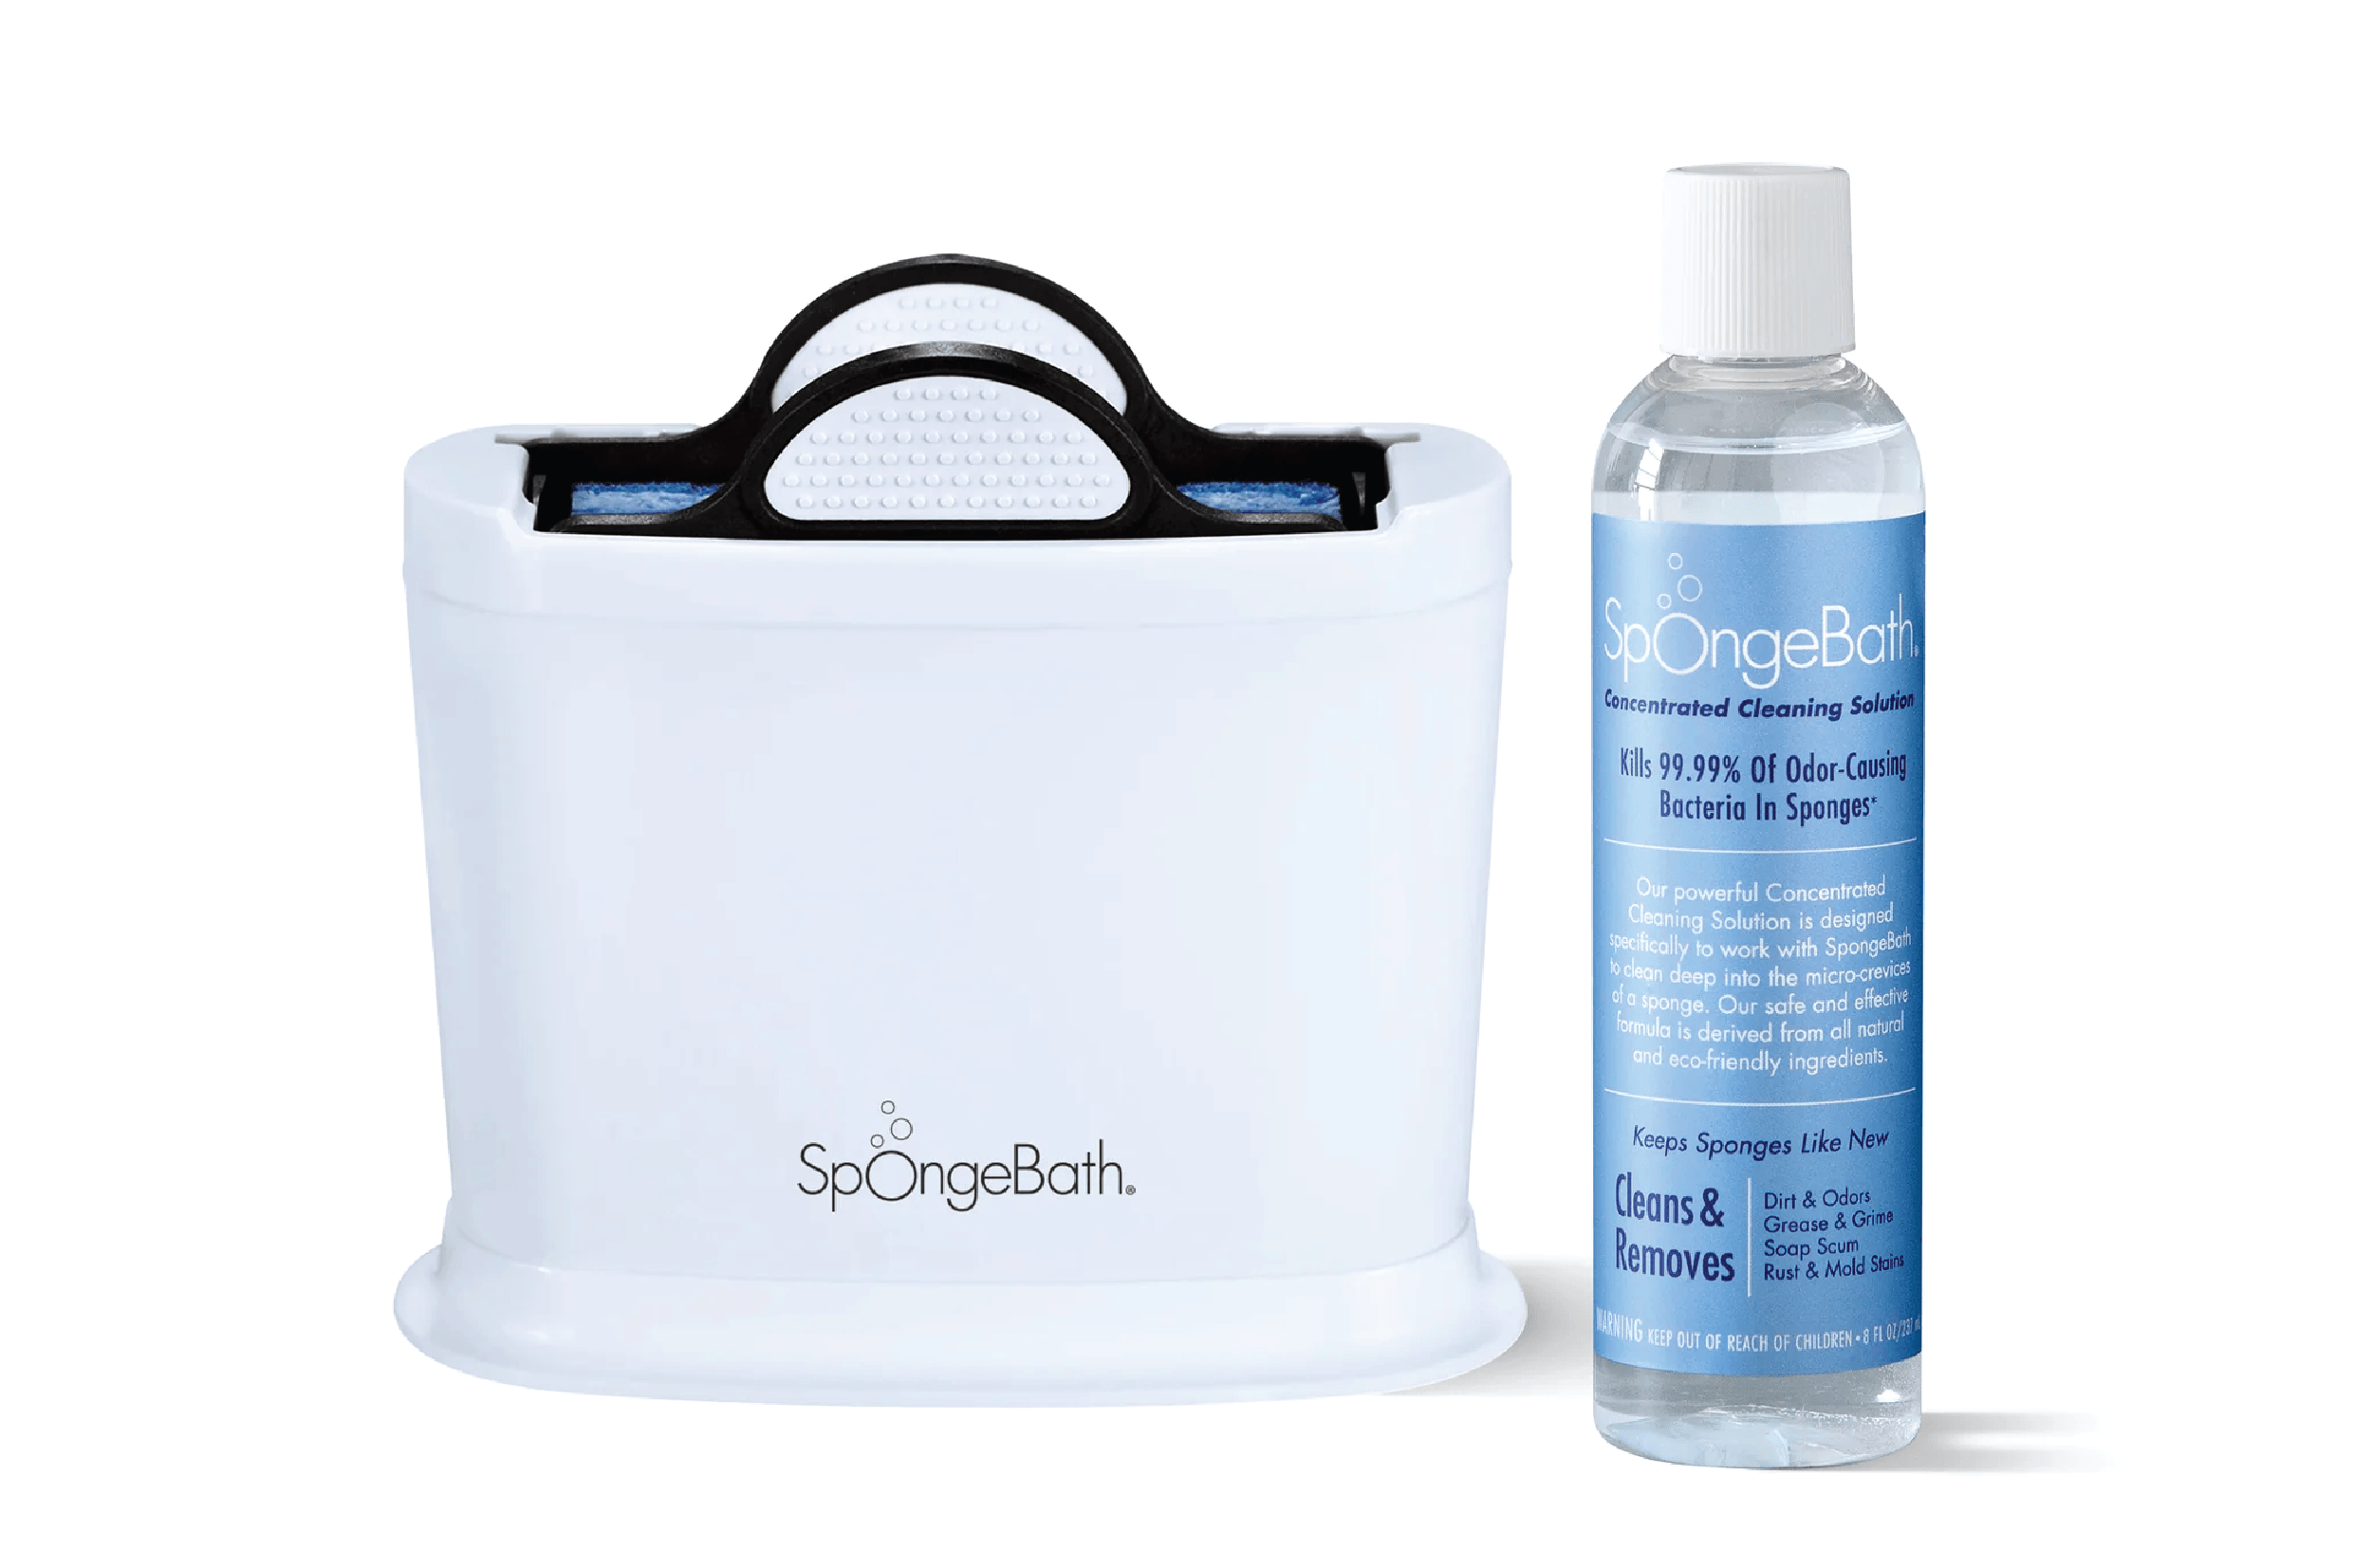
SpongeBath sells a product that cleans dirty sponges. As their marketing says: "The sponge is often the dirtiest object in your house!" The product works by soaking sponges in a cleaning solution, making them more sanitary when you need to use them.
When SpongeBath approached us, they were just starting out. Their main goal was to understand how to market their product. They asked for a market segmentation study to learn who might buy SpongeBath, what issues those people cared about, and how to best communicate the product's value. In our study, we used many different question types that demonstrate the range of survey elements available online.
Instructions and Images
We began the SpongeBath study by clearly describing the task. We told participants we wanted their advice about which messages should appear on the product label. We also emphasized the importance of honest, thoughtful responses and thanked people for their time. This information appeared in what is typically called a "text" or "instruction" survey element.
After the introduction, we showed participants pictures of the SpongeBath product and cleaning solution (Figure 13.1). We mentioned that we would later ask about the label. The ability to present images is a basic feature within online survey platforms.
Video, Audio, and Other Media
After participants examined the product, we asked them to watch a two-minute video showing how Spongebath works.
To present the video, we embedded a URL into the survey platform. Most survey platforms allow researchers to insert media from the internet or upload files from their own device. This easy incorporation of files gives online research projects tremendous flexibility, as videos and images can become part of experimental manipulations.
Multiple Choice Questions
Next, we presented participants with multiple choice questions. We asked how interested they were in purchasing the product (extremely, somewhat, slightly, or not at all interested), and how much they would be willing to pay ($0, $0-$5, $5-$10, $10-$15, etc.) Throughout the study, we used multiple-choice questions to explore different topics.
Open-Ended Items
After the multiple-choice questions, we included an open-ended item: "Please tell us what you think about this product in your own words. Feel free to share any thoughts you have such as questions, concerns, or general comments about the product." Participants typed their answers in a text box.
Open-ended items are valuable when researchers want participants to express their own thoughts without being limited by predefined answer options. These questions are especially useful for exploring new topics or gathering fresh ideas. Chapter 8 describes how to collect more in-depth open-ended responses using AI-based survey platforms.
Ranking Items
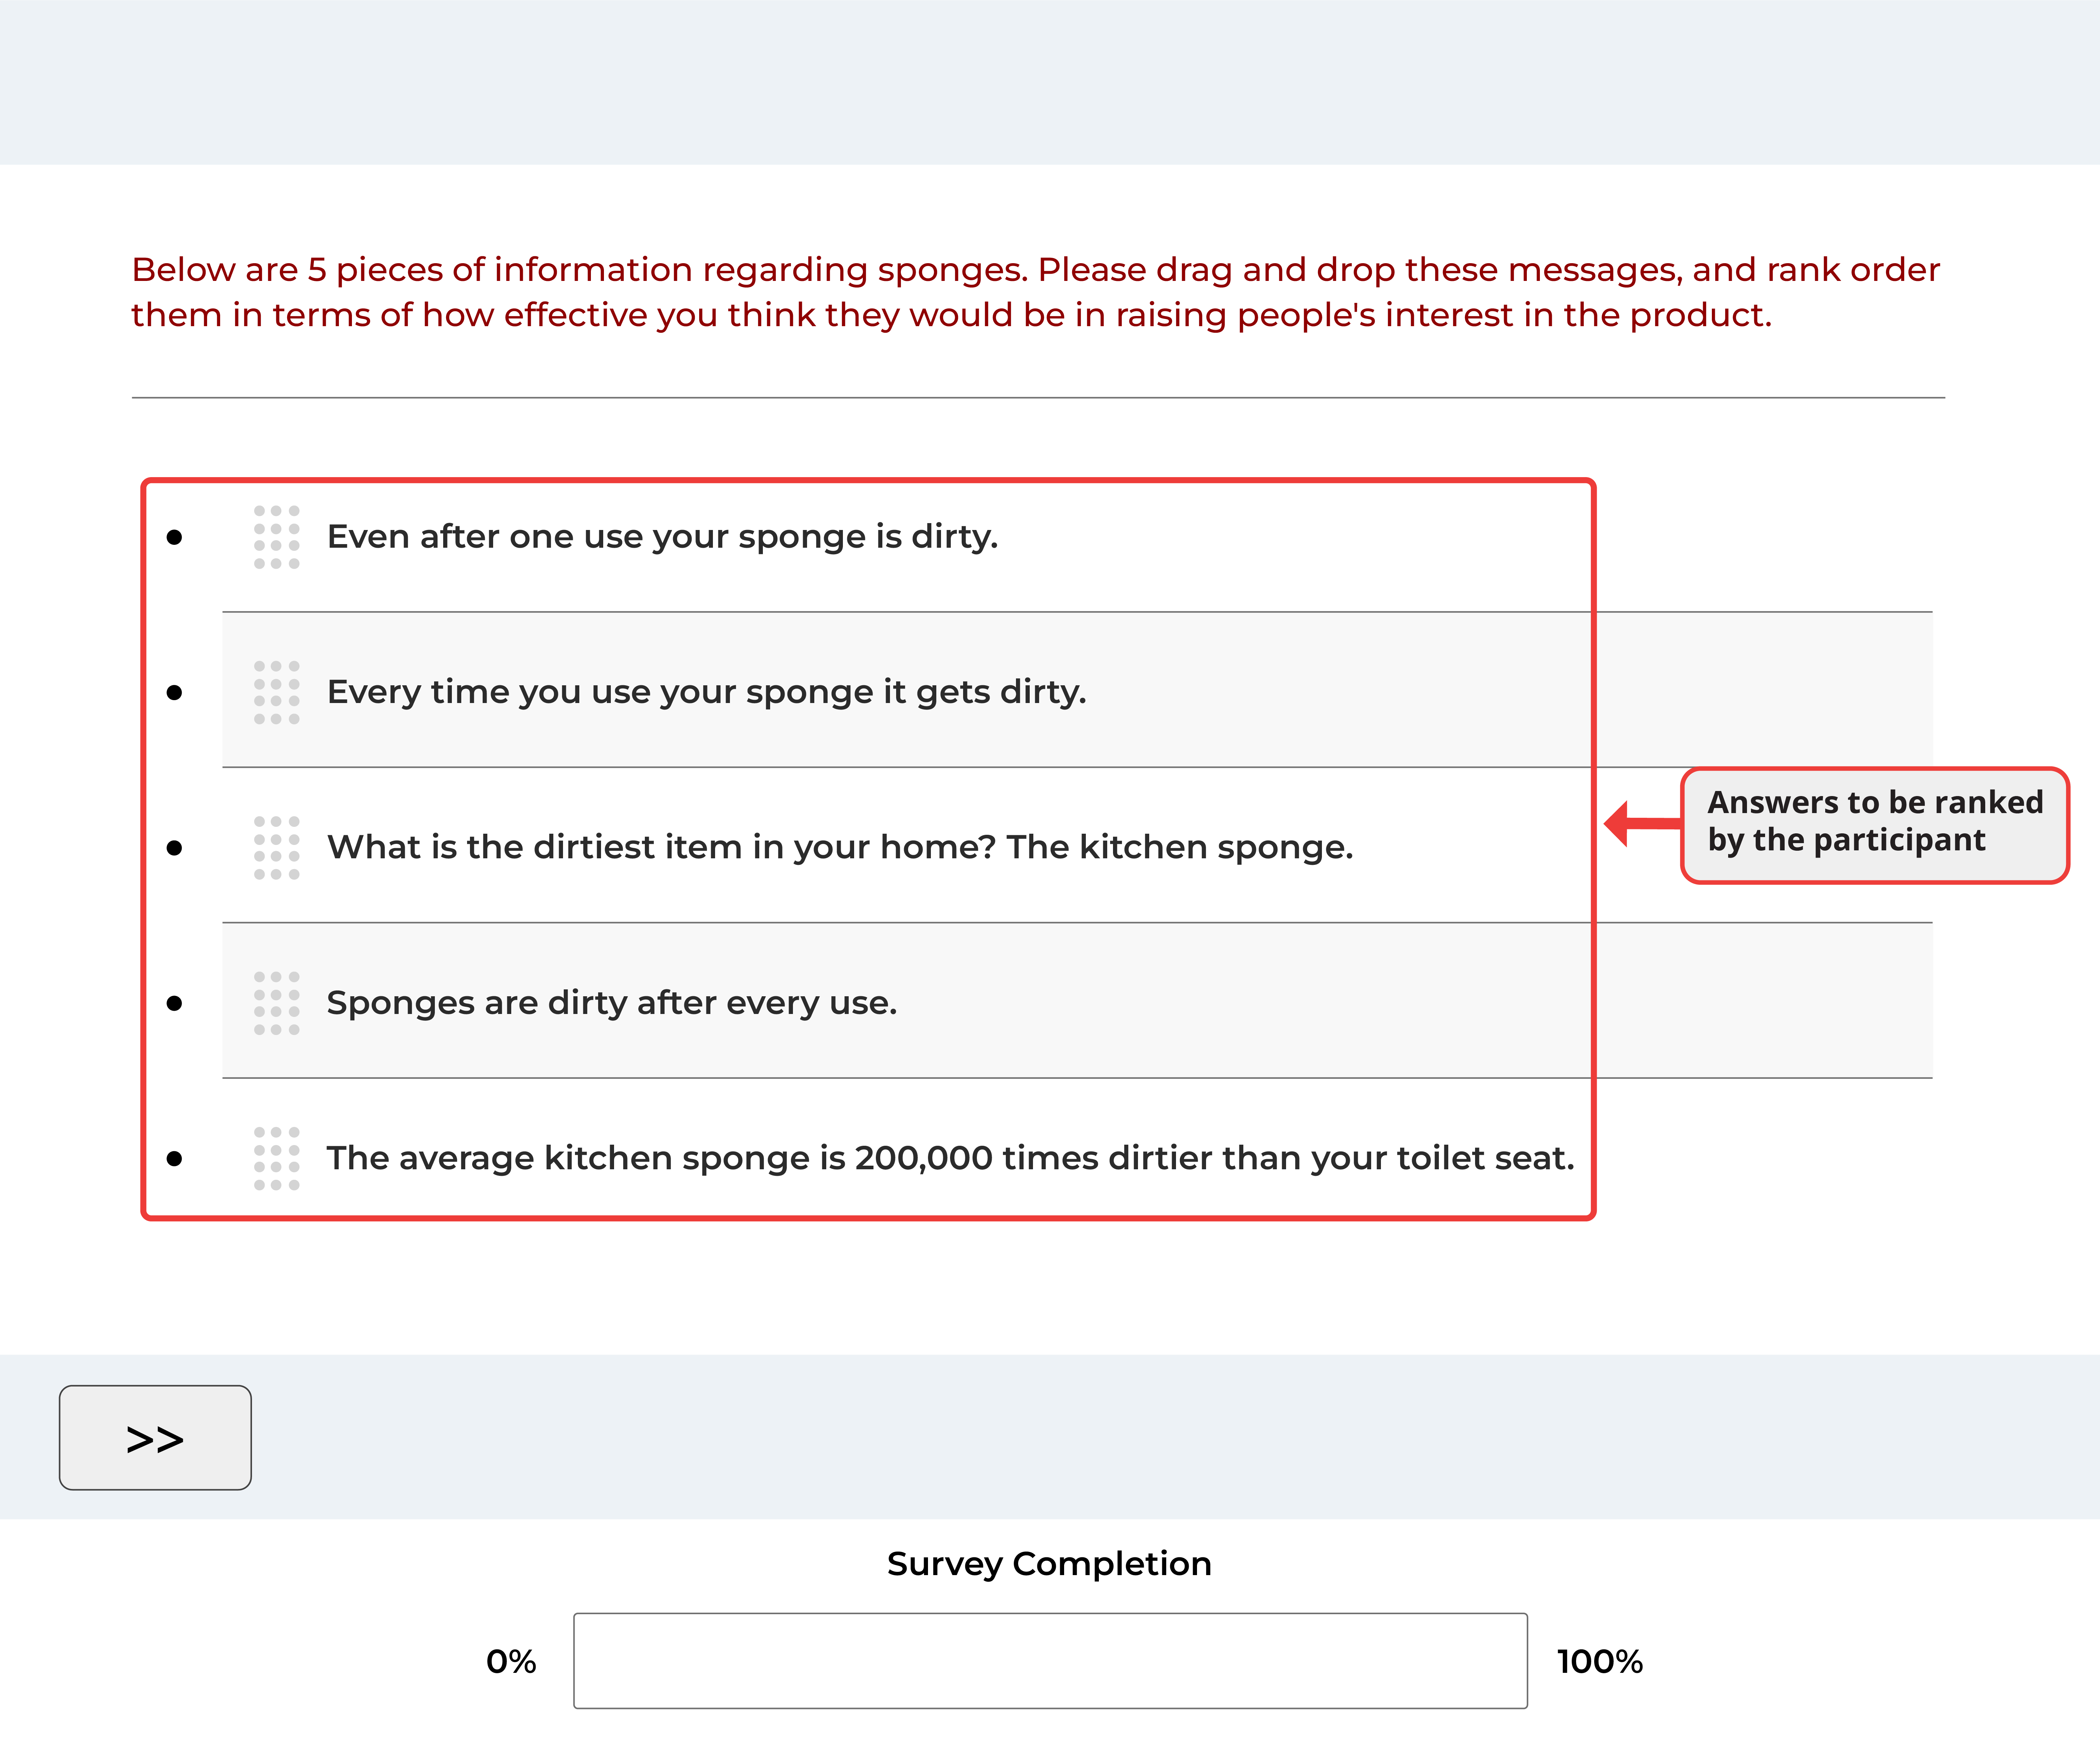
Another question type we used was a ranking question (Figure 13.2). Here, participants ranked a set of options according to their preferences. We included these items because SpongeBath's creators already knew which messages they wanted to communicate. They just needed to learn which ones would be most effective.
Why did we ask participants to rank items instead of using several multiple-choice questions to measure the same preferences?
Multiple choice questions (sometimes called rating questions) typically ask participants to evaluate something on a scale. They are useful for measuring the intensity of people's responses. Ranking items, on the other hand, show the relative priority of each answer option and reveal how several items compare to each other. Ranking questions can also be more engaging for participants, improving their overall experience.
Despite these strengths, ranking items do not show how much participants prefer one option over another. They also become unwieldy when the list of items is long. The choice between ranking or multiple-choice questions often depends on whether the researcher wants to measure the strength of attitudes or establish a preference order.
Drag and Drop
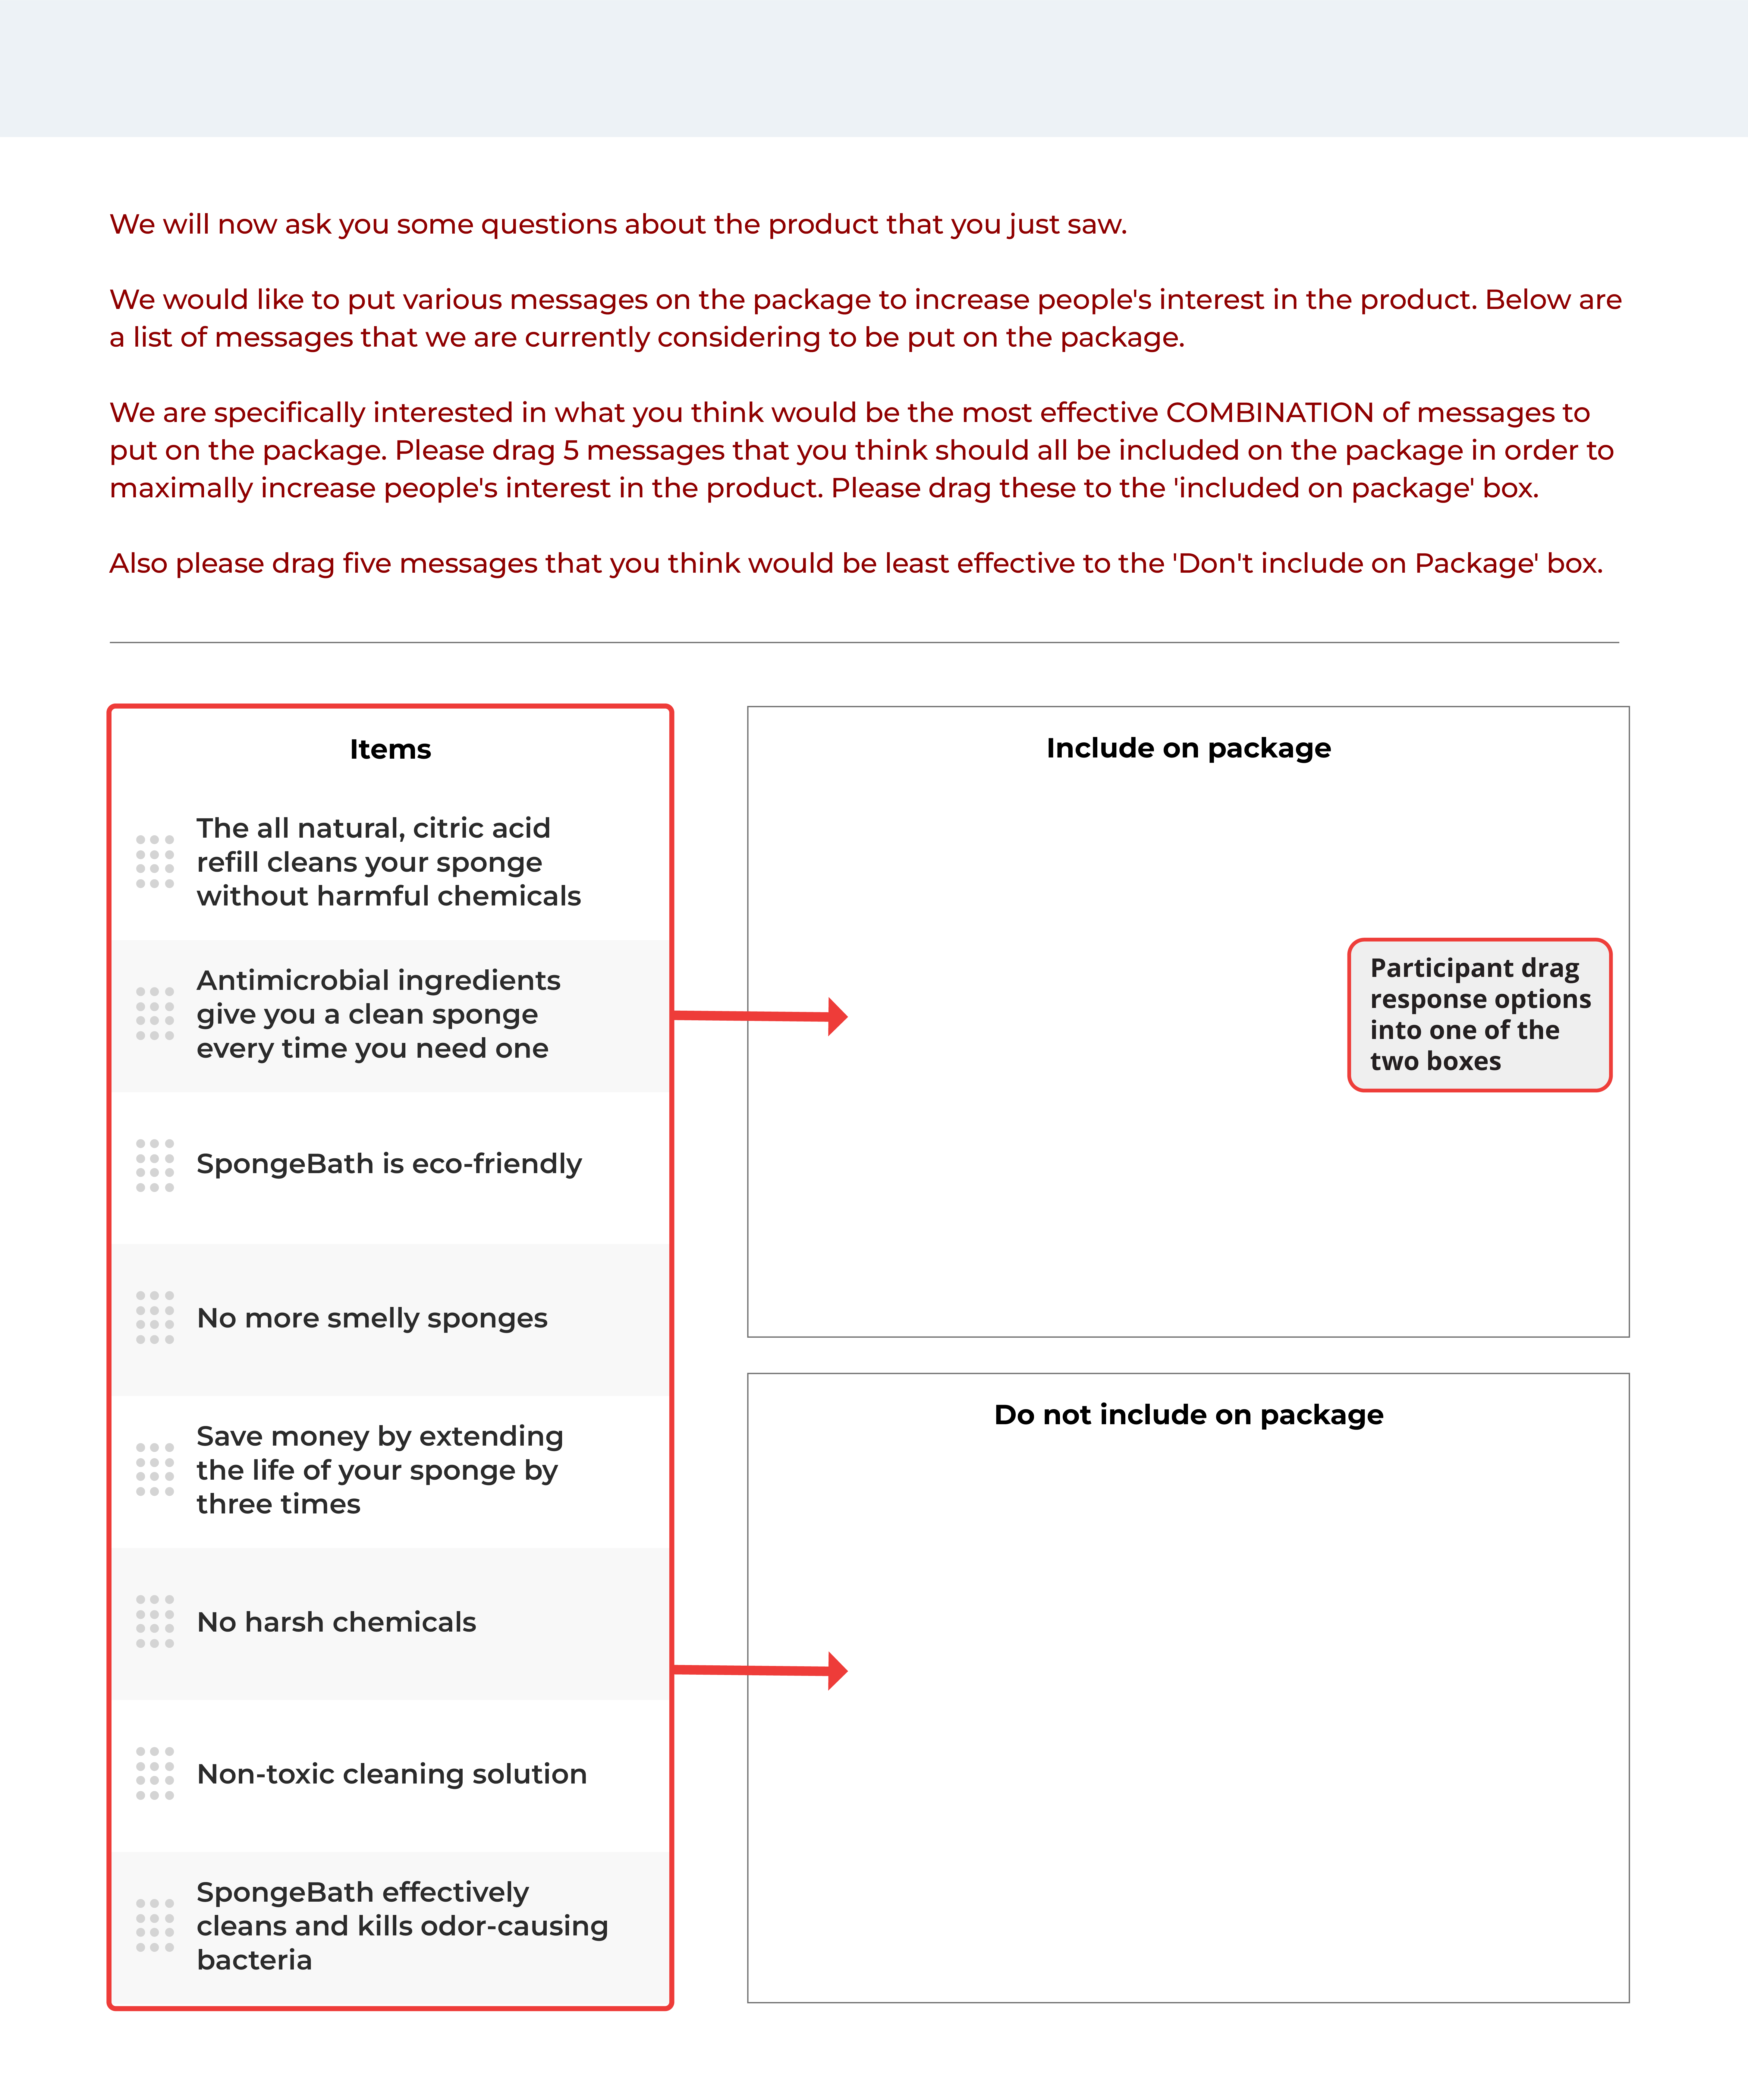
Drag-and-drop items offer another interactive way to gather online data. They work well for ranking questions and categorization tasks. Participants in our study completed the drag and drop question shown in Figure 13.3.
This question helped us understand which messages participants found most compelling about SpongeBath. They dragged potential messages into either "Include on package" or "Do not include on package" categories.
Drag and drop questions make surveys more engaging. They provide a visual way for participants to organize items, creating a digital version of sorting tasks that traditionally required face-to-face studies.
Heat Maps
A unique online question type is the heat map. This asks participants to look at an image and select areas they like, dislike, or find interesting. As participants interact with the image, the system records data and creates output like what appears in Figure 13.4.
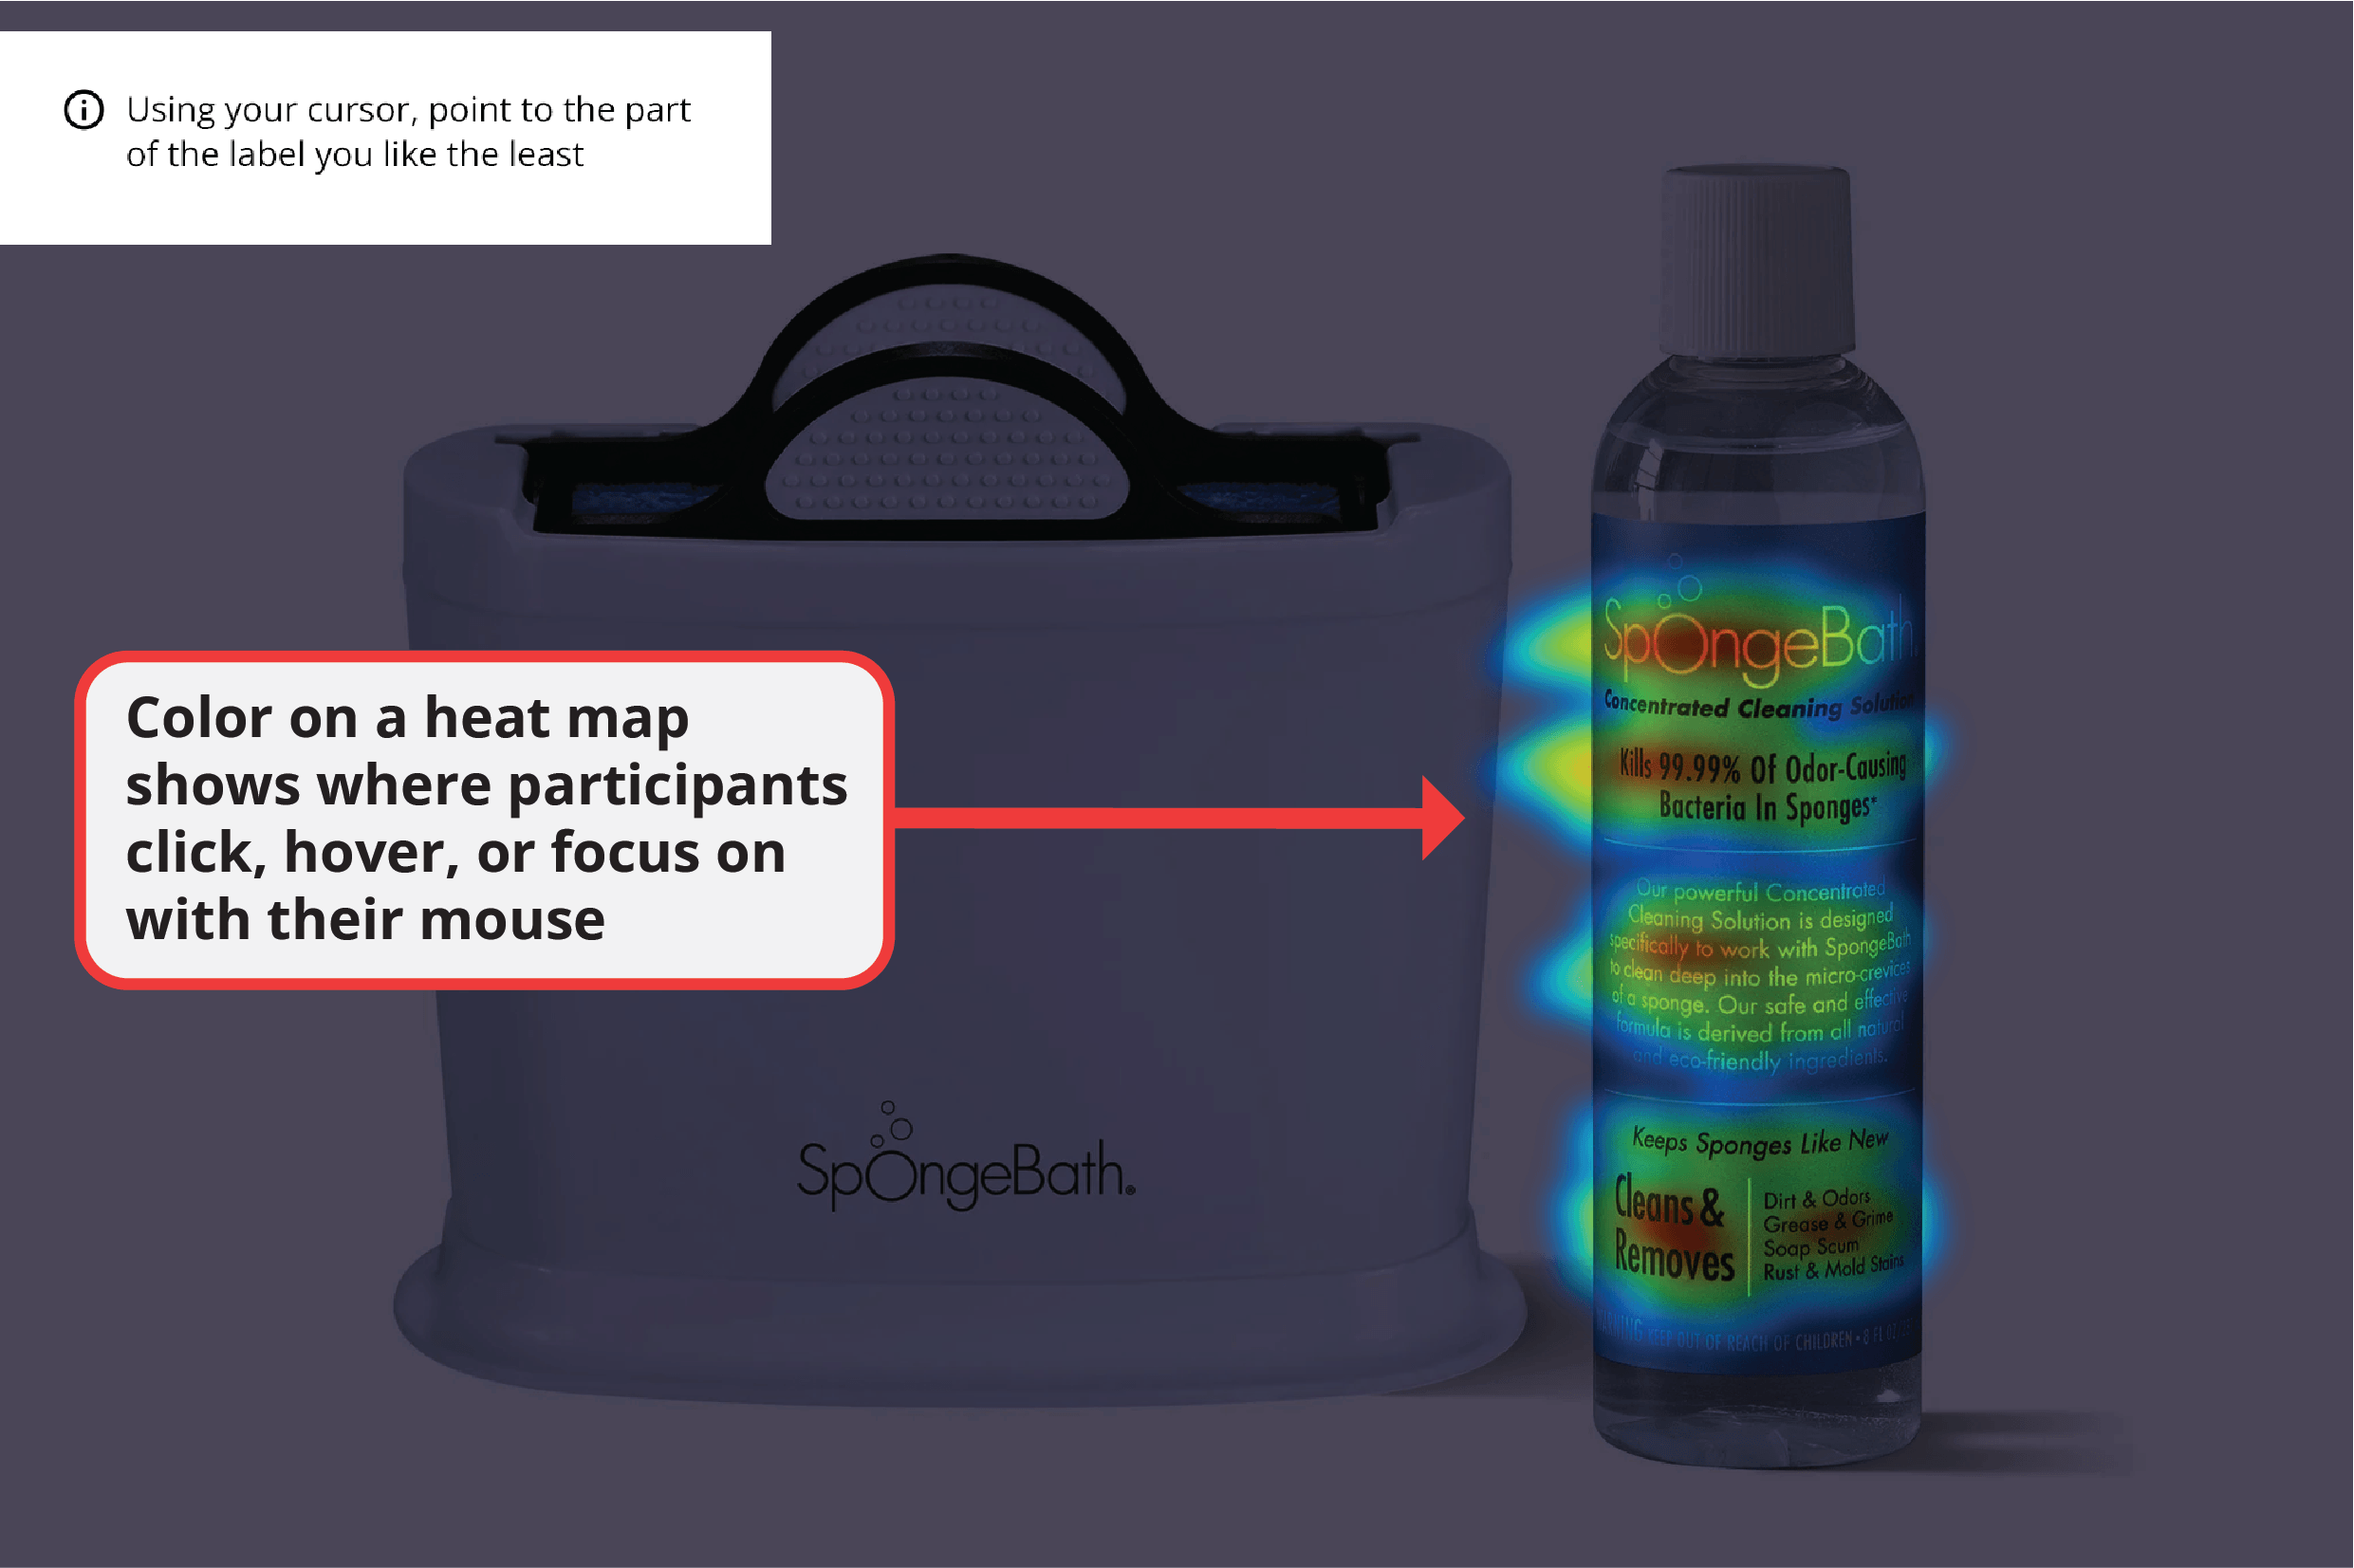
The heat map shows where participants clicked during the task. In our study, people selected portions of the image they did not like. As can be seen from the red areas in Figure 13.4, certain parts of the label were unappealing to participants.
Heat maps offer an interactive experience for participants and reveal interesting patterns for researchers, though they are not relevant to all projects.
Sliders
The final question type we will highlight is the sliding scale. These have an offline equivalent called the visual analog scale (VAS).
Sliders feature an interactive bar with a movable pointer that allows participants to visually show their position on a scale. While sliders can be designed with or without marked intervals, they generally offer a more engaging alternative to traditional scales. We did not include sliders in the SpongeBath survey, but Figure 13.5 shows what these questions might have looked like.
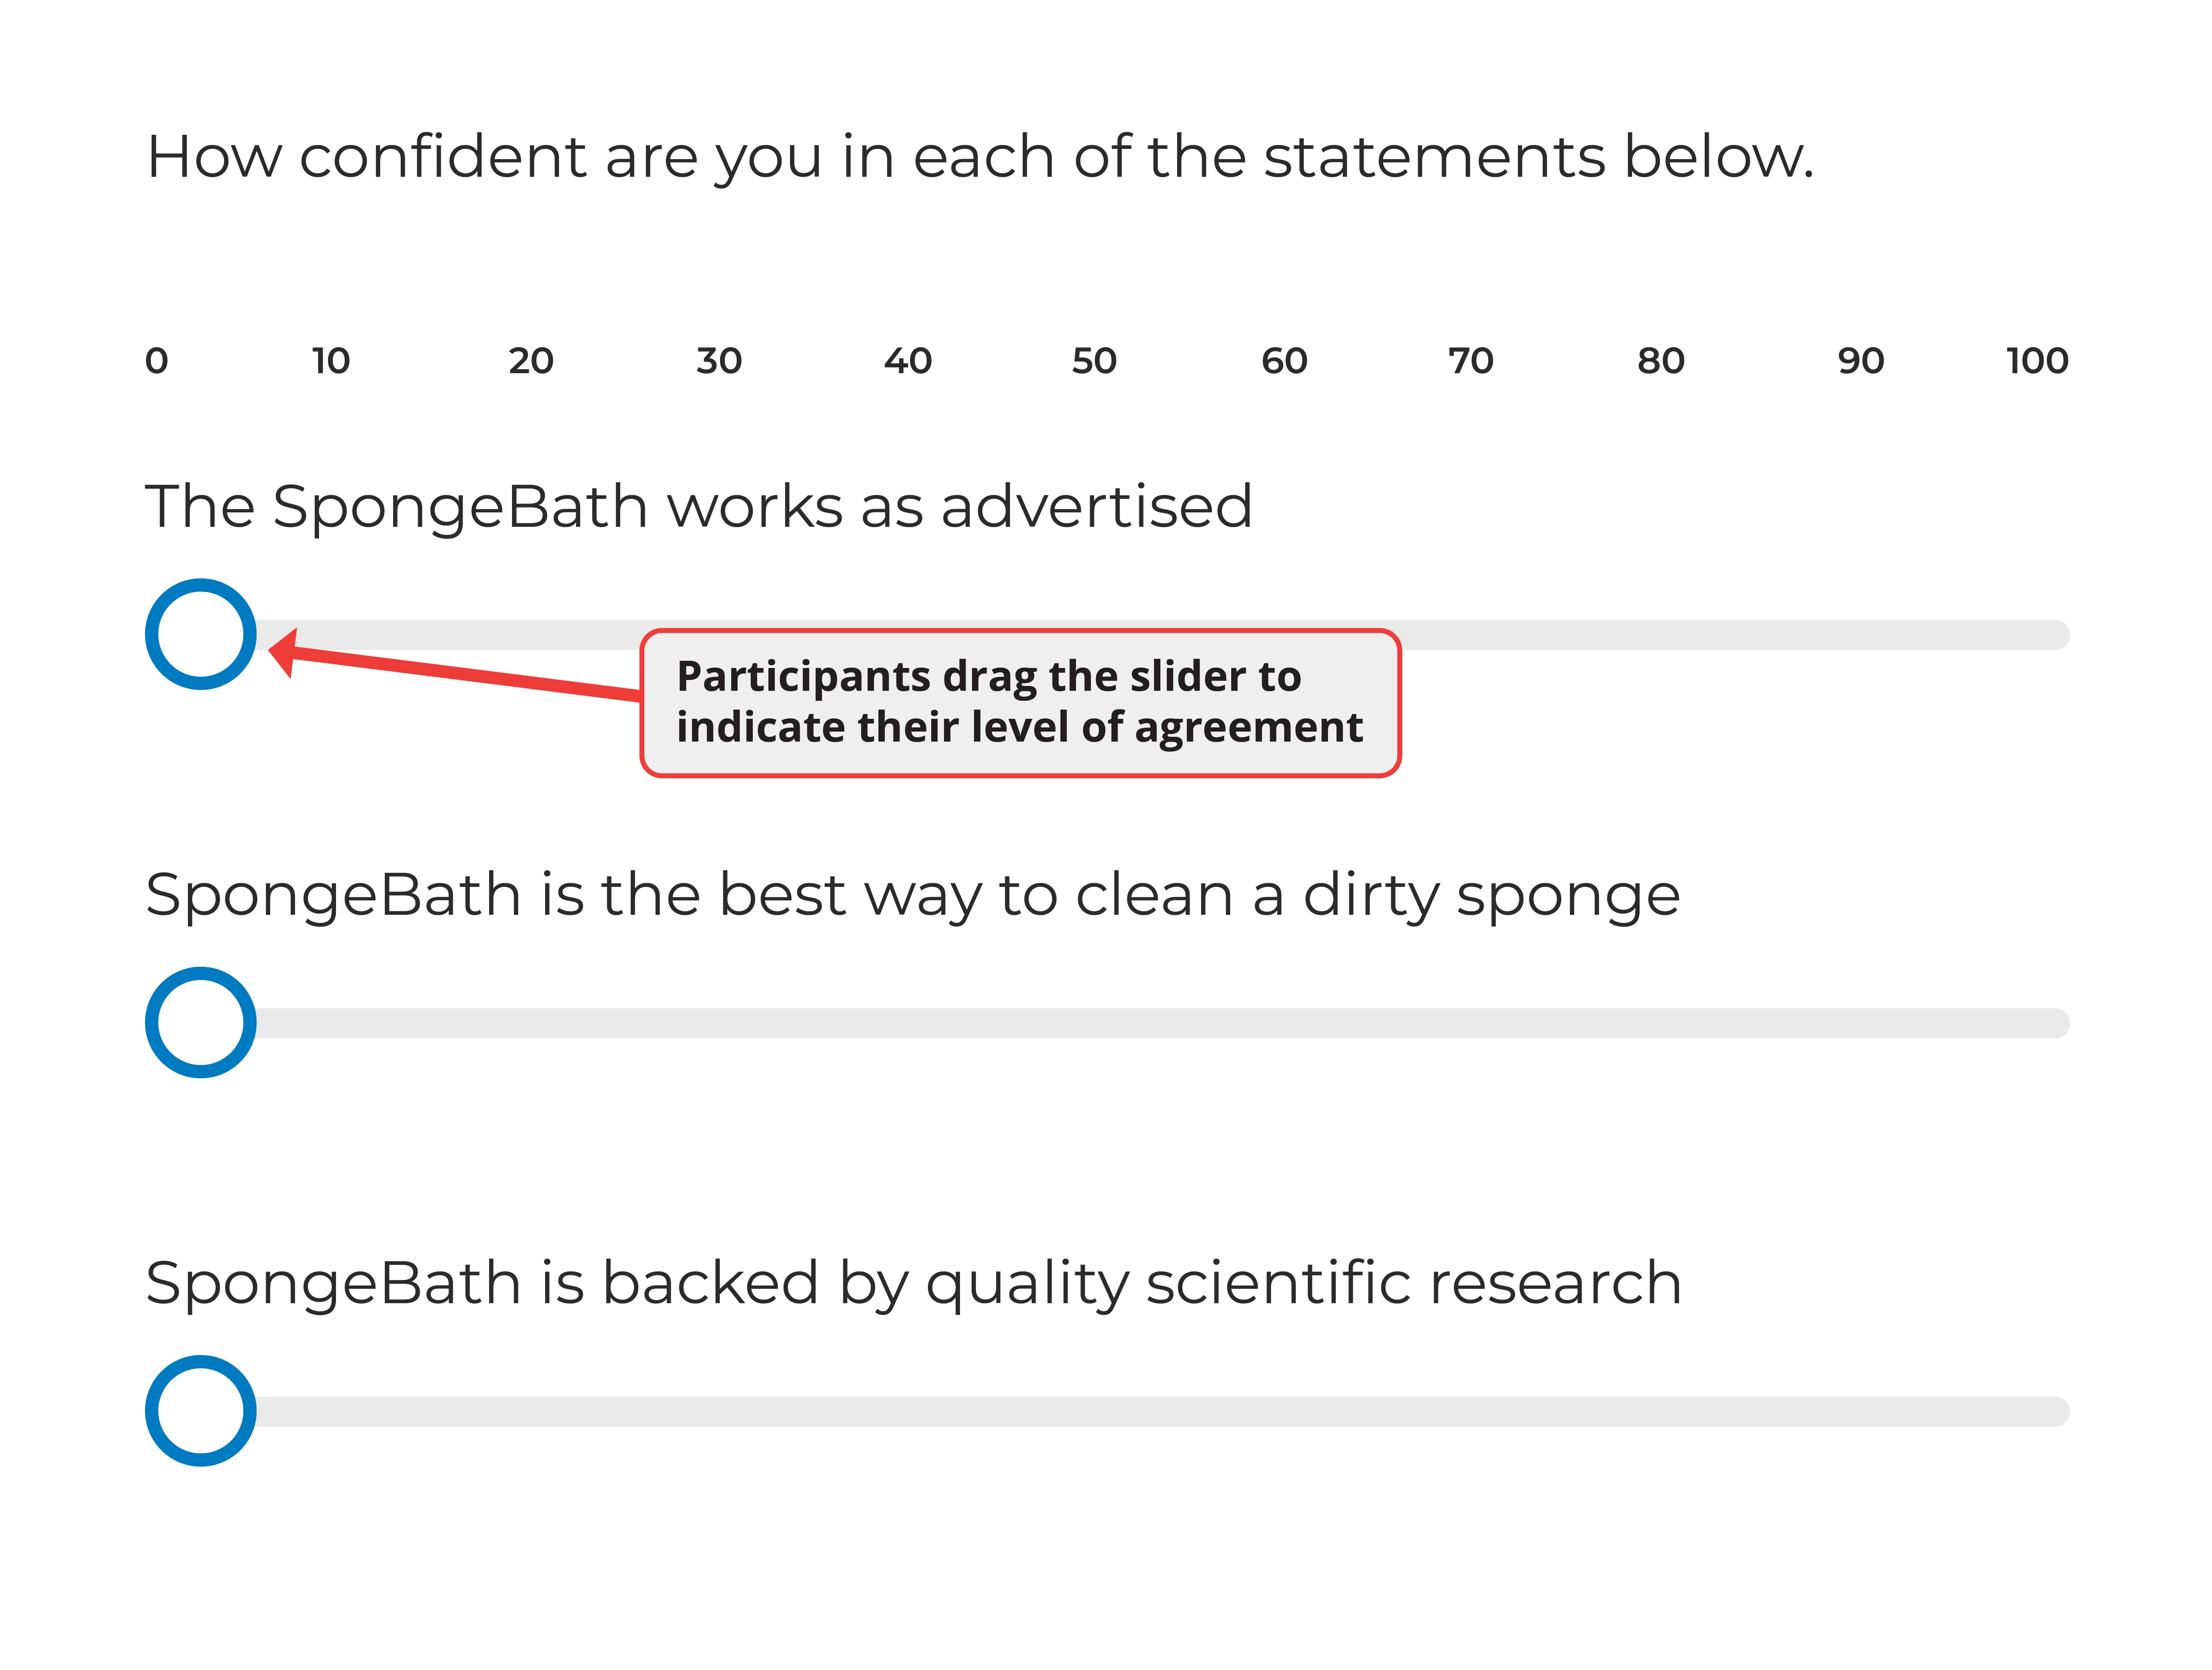
Sliders capture a participant's position on a continuum. Like many question types, sliders can be harder to use on mobile devices than on desktop computers. With fine-grained scales (like 0 to 100), some device settings make it difficult for participants to select the exact point they want.
Consider which devices your participants might use or perhaps limit participation to desktop computers when using sliders.
Summary of Survey Elements
Online surveys give researchers many ways to present materials to participants. Individually, these survey elements are the smallest building blocks within an online project. Together, they can be combined in ways that engage and interest participants.
Yet beyond individual elements, researchers must consider how to arrange the pieces of a survey. The next section shows how they do this with question blocks.
Organizing Elements with Blocks
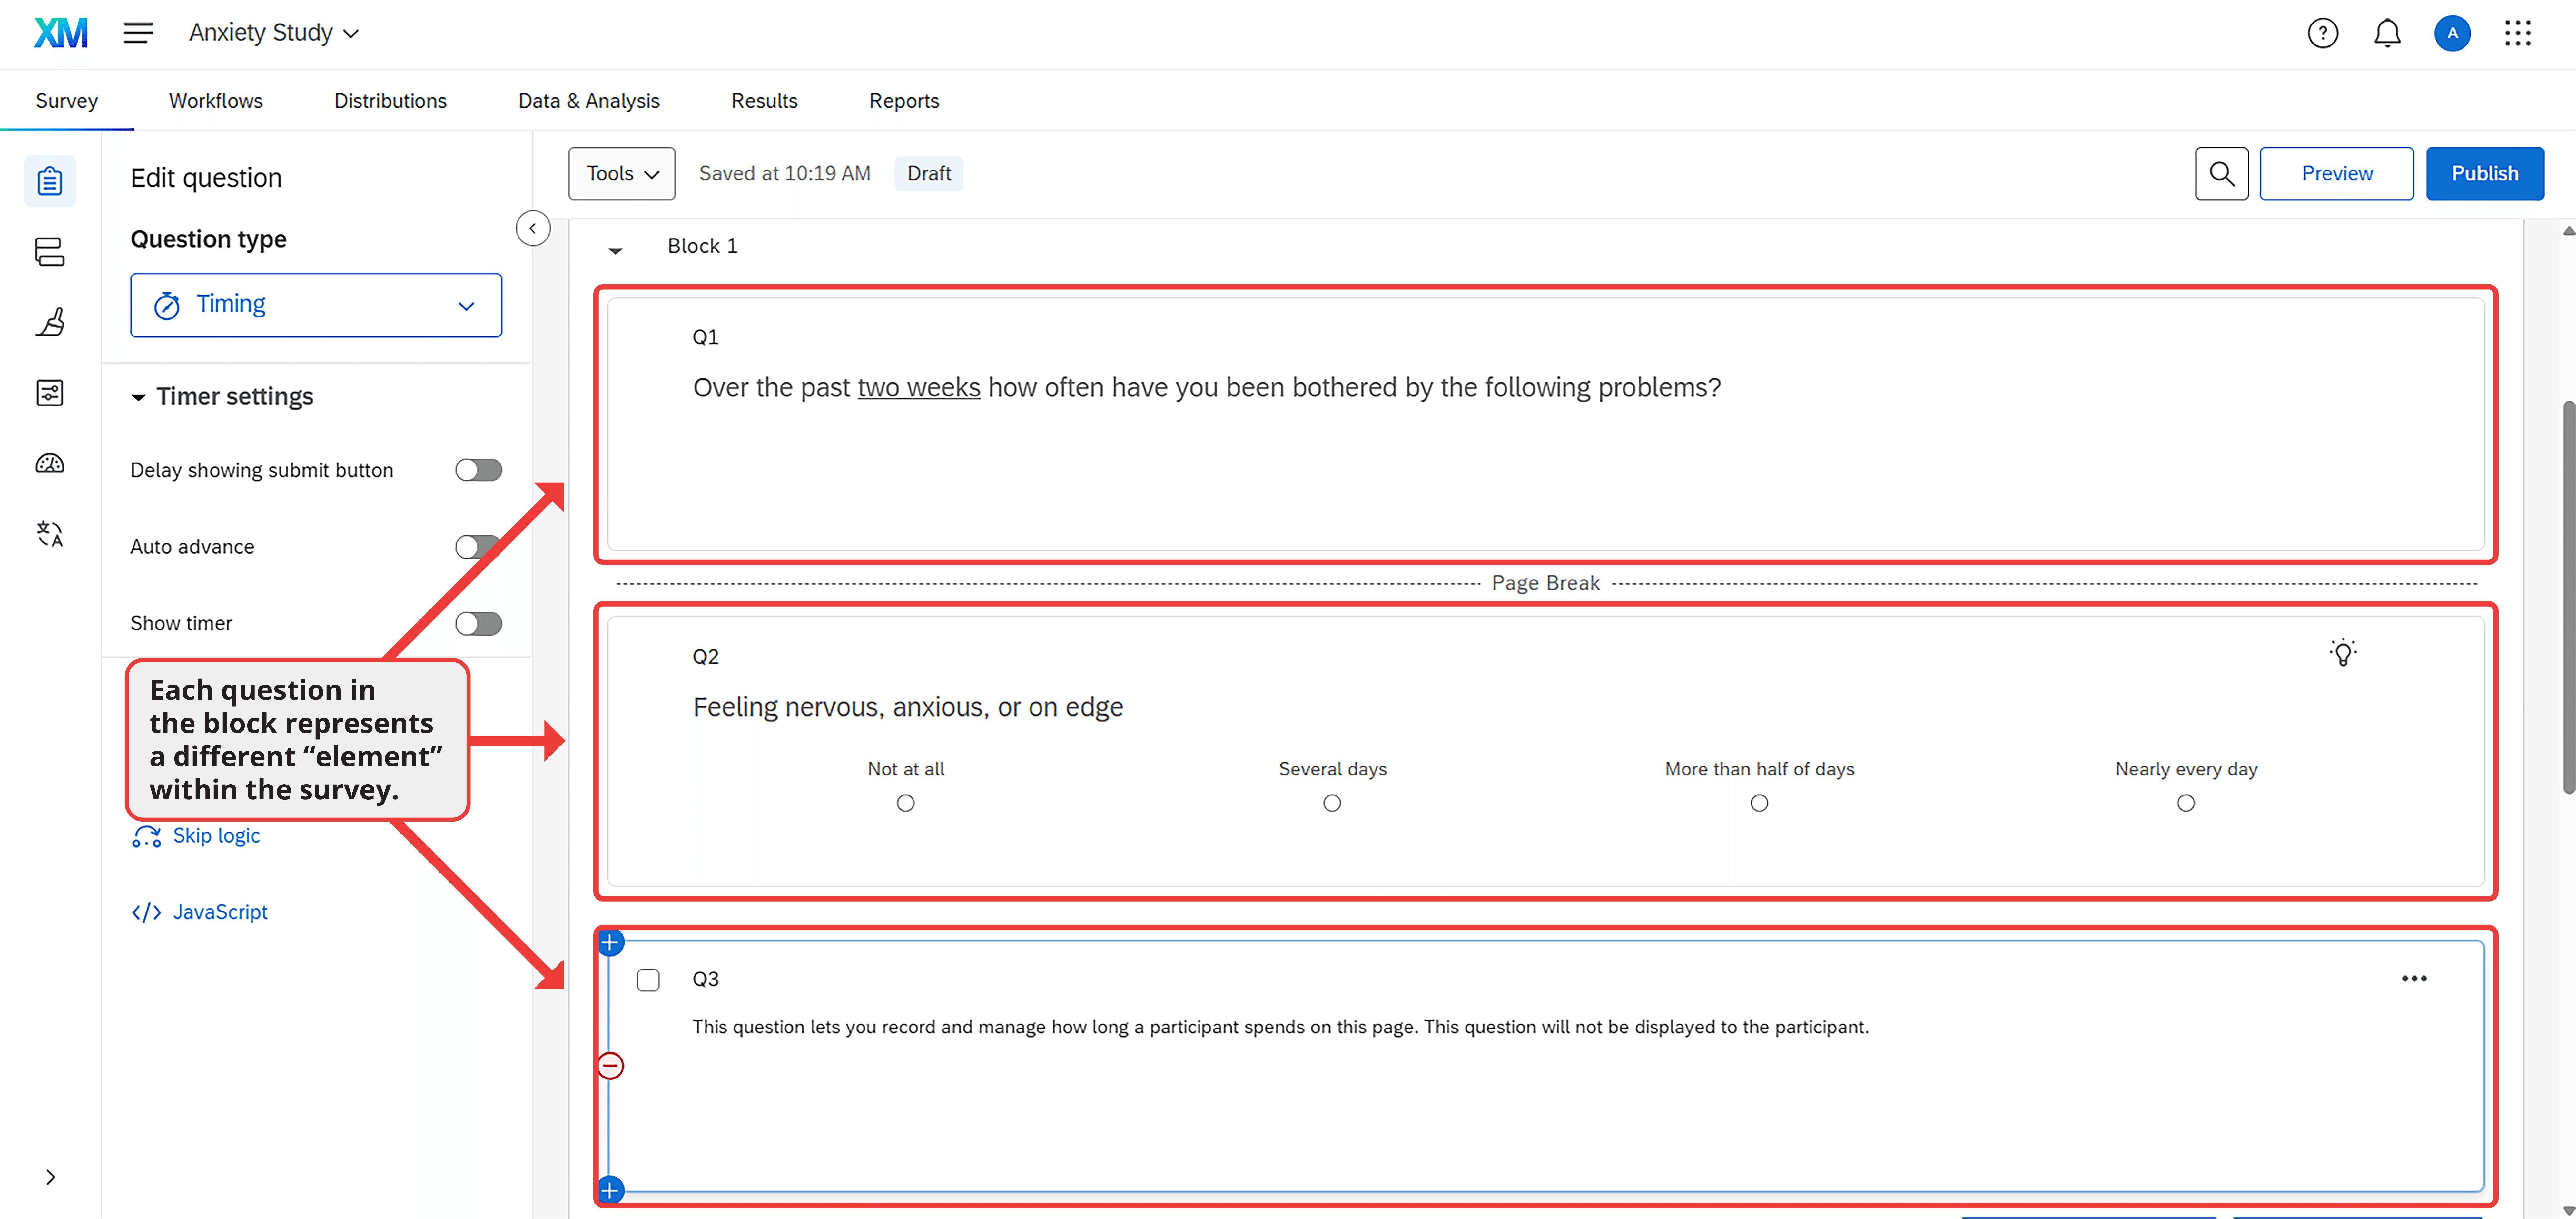
A question block is a group of survey elements within an online project. Figure 13.6 shows a block containing three elements: first, a short set of instructions; second, a multiple-choice question about anxiety; and third, a question that records how long participants spend on the page.
Two important features of this block are worth noting. First, some elements are separated by page breaks, which allow researchers to display content on different screens. Second, the questions in the block relate to each other. When building a project, researchers typically group questions on similar topics or from the same instrument within a single block. Putting elements into blocks makes organizational sense and gives researchers control over when and how those elements appear to participants.
To demonstrate the benefits of organizing items in blocks, let's revisit the correlational study from Chapters 4-6. In that study, we examined the relationship between anxiety and depression. Anxiety was measured using the GAD-7 (see Table 3.1 for items) and depression using the PHQ-9. Below, we will show how questions can be arranged in blocks and highlight several important considerations.
Arranging Blocks
There are two ways that arranging blocks can be useful within an online survey. First, we can randomly determine the order in which blocks appear. Second, we can direct participants down different paths based on their previous answers. The value of both options becomes clear when we examine what they allow researchers to accomplish.
Randomization
Most survey platforms contain a randomization tool (also called a randomizer). This tool allows researchers to present blocks in random order. Without this feature, it is impossible to conduct an experiment or counterbalance the measures within a study.
Between-Subjects Randomization. The most common use of the randomization tool is for between-subjects experiments. Remember from Chapter 7 that each participant in a between-subjects experiment is randomly assigned to one experimental condition, regardless of how many conditions exist in the study. By randomly assigning participants to conditions, the researcher ensures all groups are equivalent except for the independent variable they experience.
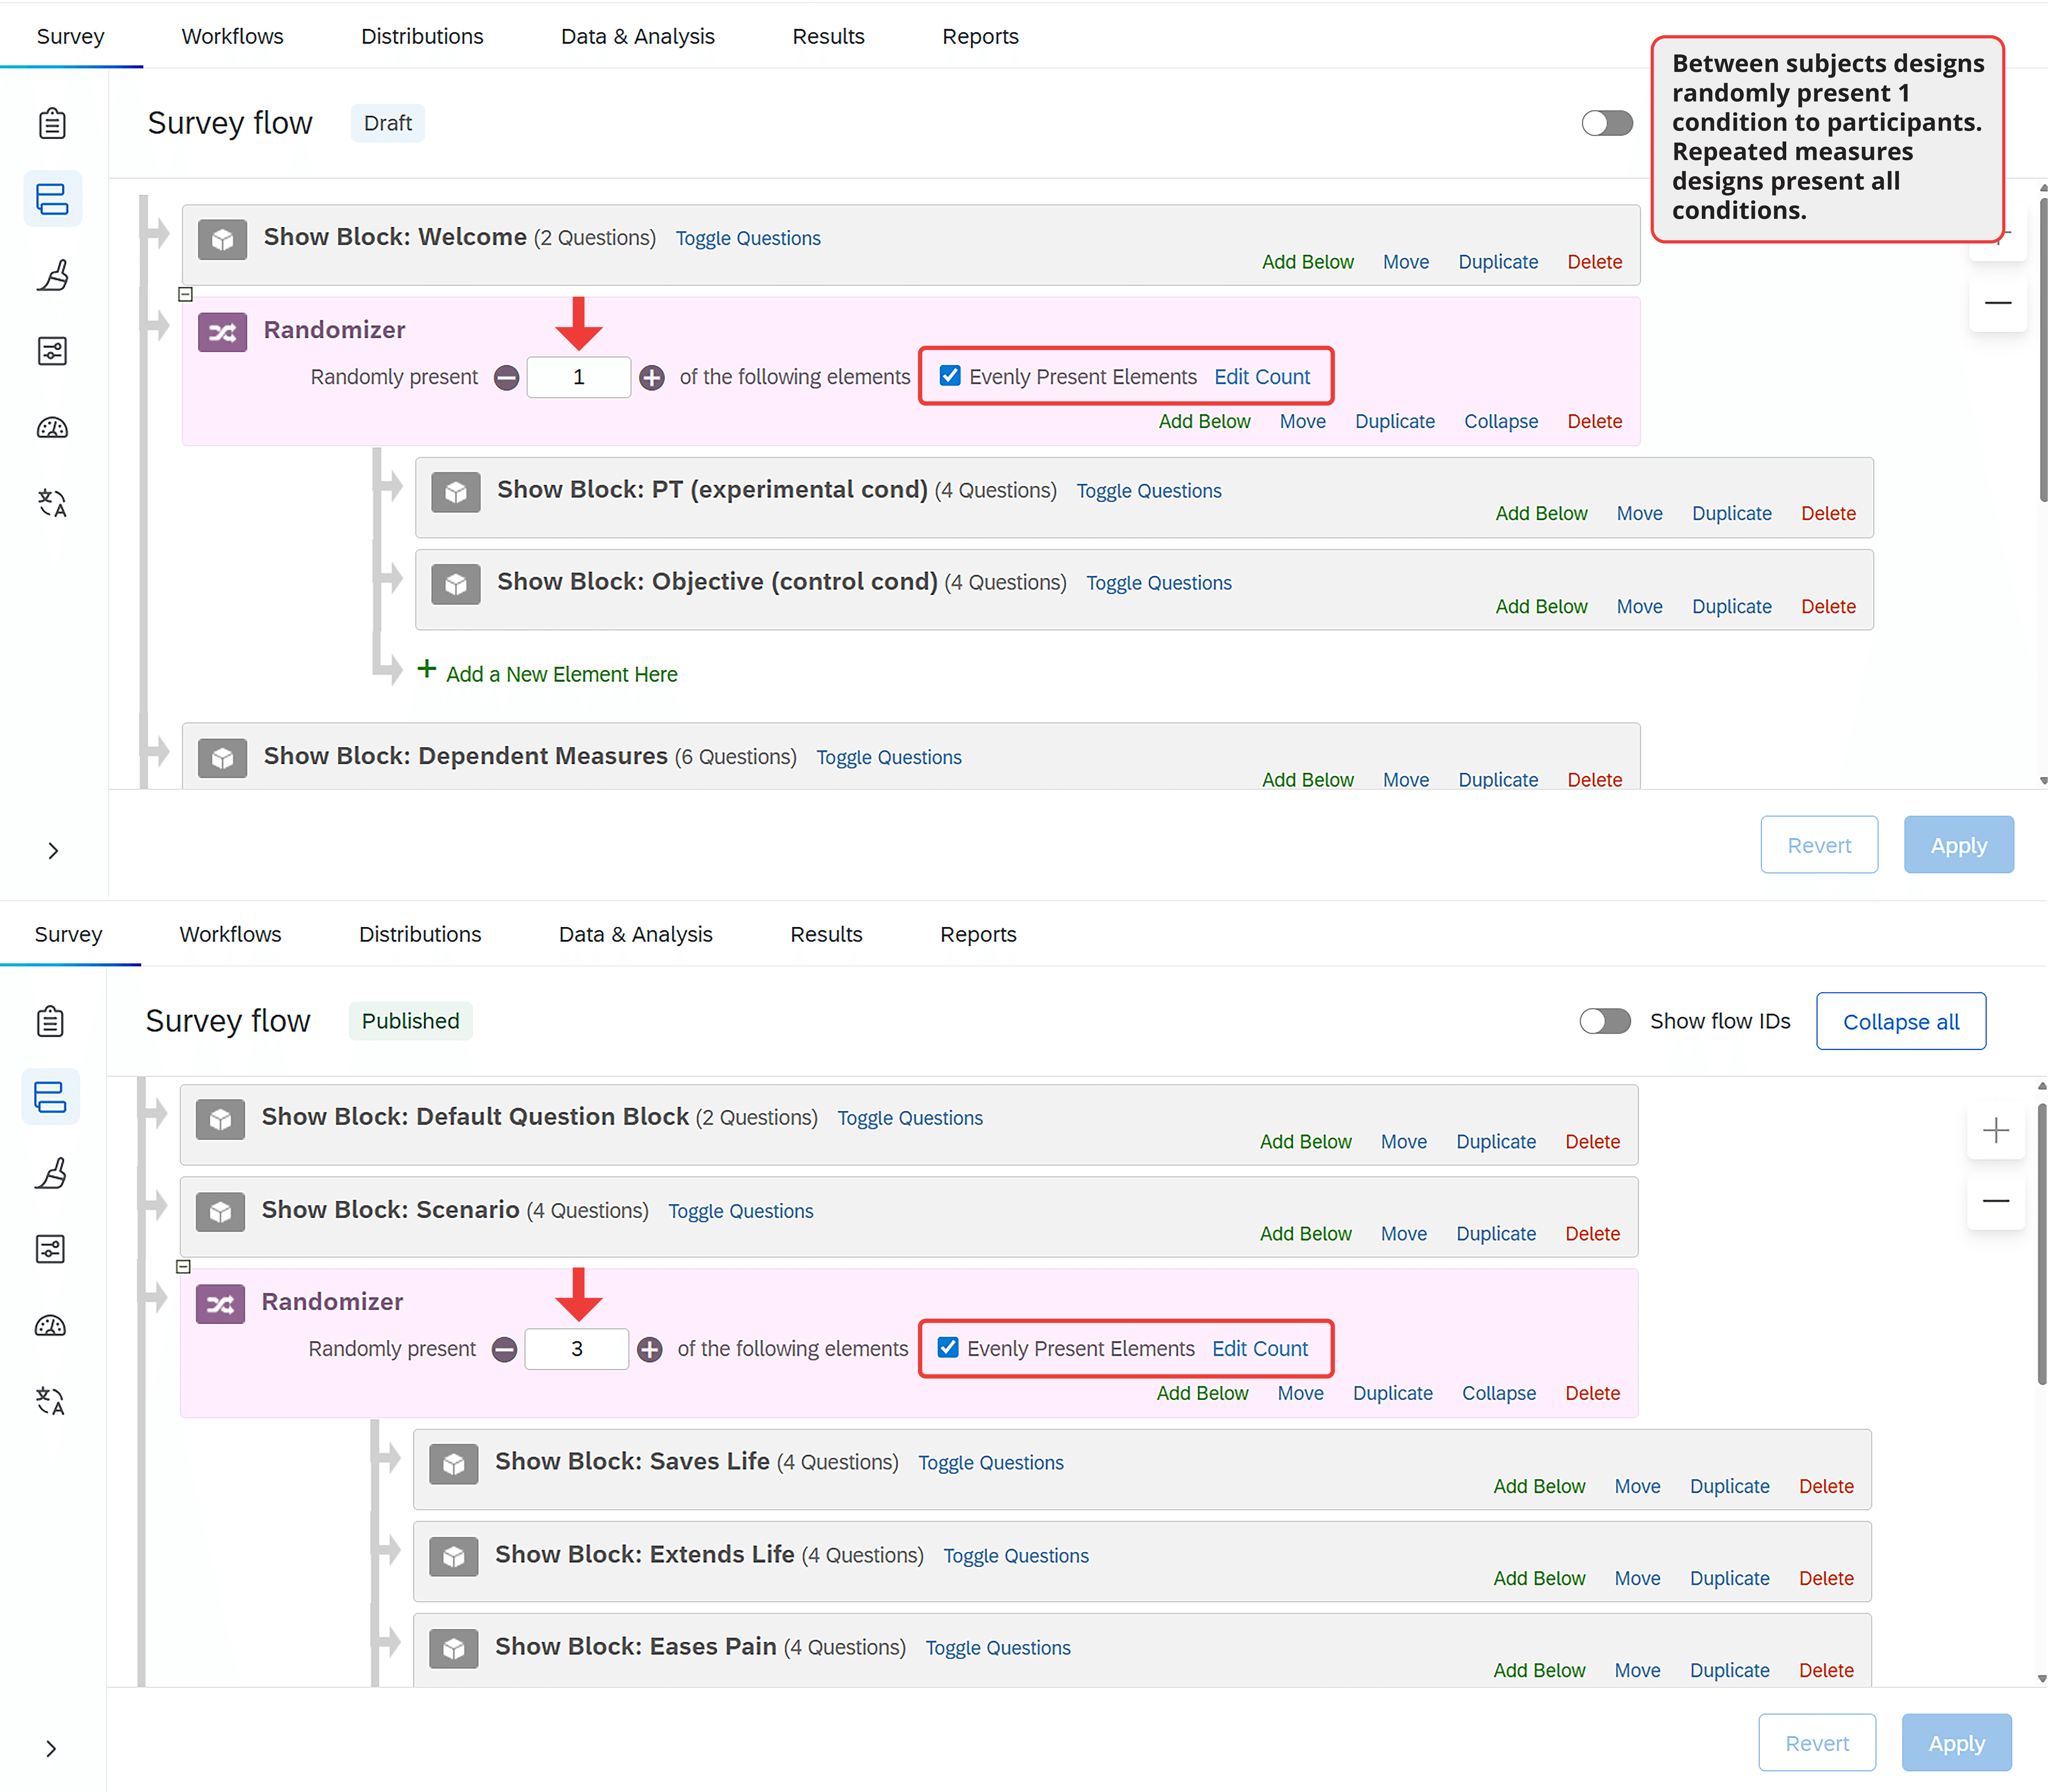
Using the randomization tool for a between-subjects experiment is straightforward. As shown in Figure 13.7 (top panel), researchers simply enter the survey flow area of the platform. Within the survey flow, they add a randomizer and place each block that should be randomly presented under it. Using the available options, researchers can ensure each participant sees only one block and that blocks are evenly distributed across participants.
Within-Subjects Randomization: Counterbalancing and Repeated Measures. Randomization is useful beyond between-subjects experiments. For instance, in a correlational study measuring anxiety and depression, researchers might worry that answering questions about depression could influence people's responses to questions about anxiety (or vice versa). If so, they could counterbalance (randomly determine) the order of the questionnaires. When measures appear in a random order to different participants, order effects cannot explain any association between the two constructs.
We can see how within-subjects randomization differs from between-subjects randomization by comparing the top and bottom panels of Figure 13.7. In the between-subjects design, participants see just one block beneath the randomizer. In the within-subjects design, they see all blocks, but in a random order determined for each participant.
Beyond correlational studies, within-subjects randomization is useful for repeated measures experiments. In these experiments, participants experience every level of the independent variable. As with correlational studies, the only way to prevent carryover effects is to randomize the order of conditions.
Branching and Skip Logic
Another way to tailor the survey experience is through branching and skip logic. When used properly, these tools allow researchers to present participants with relevant questions based on their previous answers. This customization is not necessary for all research projects, but it saves time when used effectively.
Branching not only maintains participant engagement but also improves data accuracy. For example, in a survey about treatment experiences for various medical conditions, branch logic can be used to skip treatment questions for conditions a participant has not experienced.
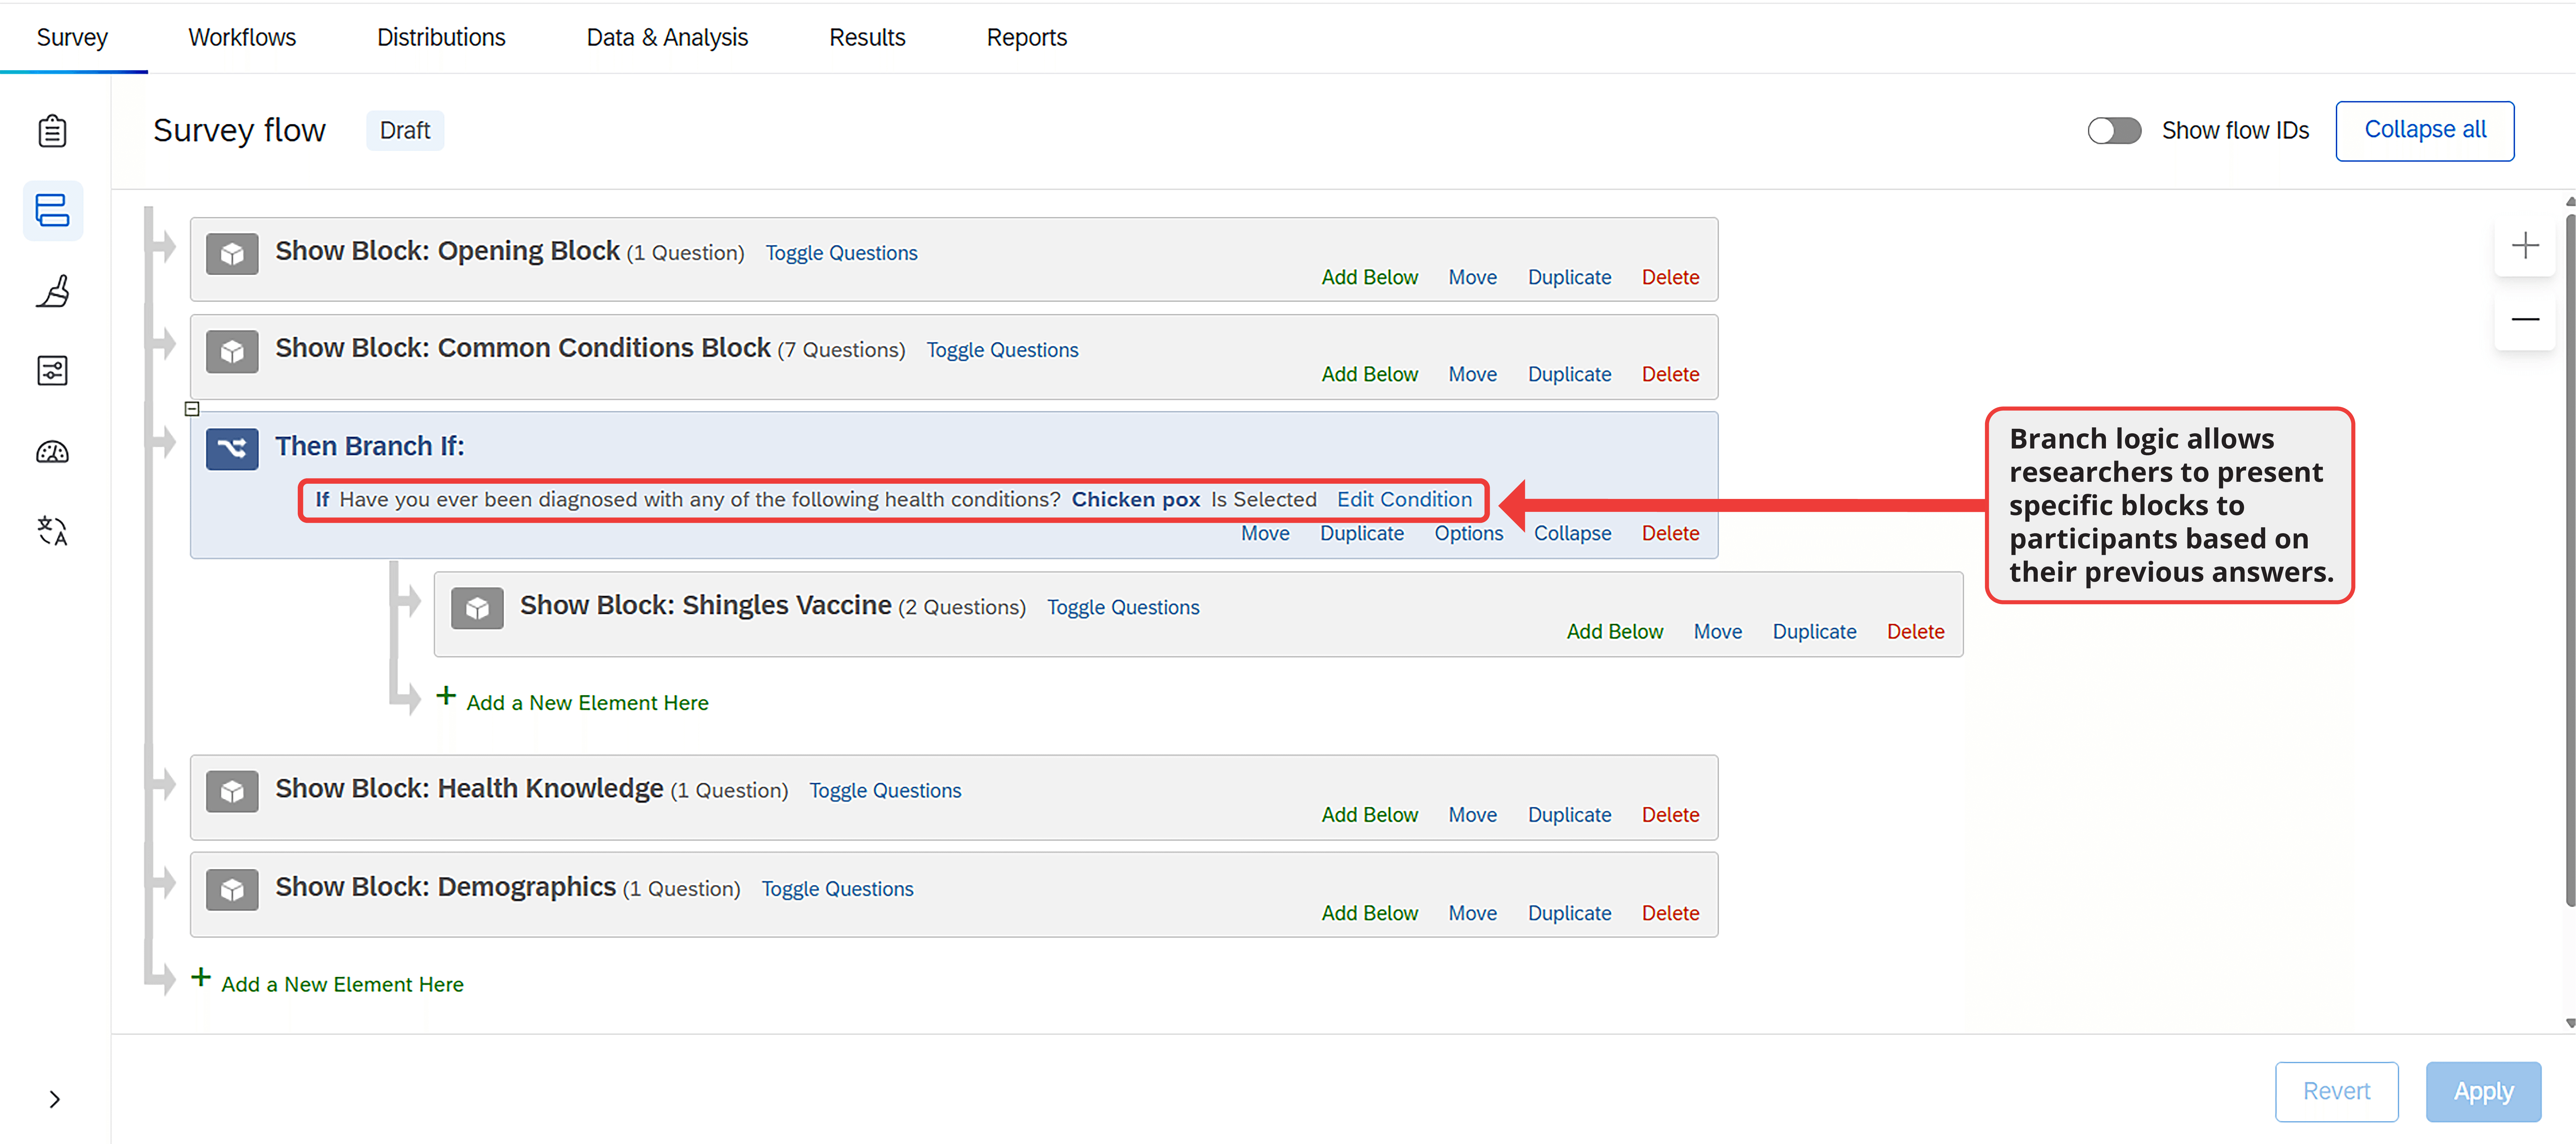
Programming a survey branch can occur either within the survey flow or within a block. After adding a branch to the flow, the researcher must specify the logic it will follow (Figure 13.8). For example, a researcher might specify that if a participant indicates they have never been diagnosed with a particular condition, the survey should skip to the next condition, the next block, or wherever the researcher wants the participant to go.
Best Practices for Survey Design
Explore what research has to say about how to best program a survey
When designing a study, researchers face several important decisions about how to present survey elements to participants, regardless of the research topic.
Consider a study that measures personality with the Big Five Personality Inventory (BFI; John et al., 2008). The BFI contains 44 items that form a single instrument. It is best to present the BFI in a single block, but within that block a researcher could choose to place all the items in a single group (formally known as a matrix question; see Figure 13.9), as individual items on separate pages, or in some other configuration. Which is best?
Or consider another issue. Notice in Figure 13.9 the personality items use a five-point scale. Is five the optimal number? How do we know participants shouldn't be given 6, 7, or 11 answer options?
These questions bridge survey design with survey methodology, which is the study of how to effectively develop, implement, and analyze survey data. The answers matter because they affect both the experience of participants and data quality. In fact, research shows that participants cite structural and visual design issues as one of their biggest frustrations with online surveys (Fowler et al., 2023), highlighting the importance of getting these elements right.
Below, we will examine methodological considerations in online surveys. We outline current best practices for presenting different question and answer options, combining empirical evidence with our practical experience.
Matrices or Standalone Questions?
When a project includes multiple questions, as nearly all projects do, researchers must decide whether to program the questions as a matrix or as standalone items. For example, in the project examining the association between anxiety and depression from Chapter 4, our anxiety measure had 7 items, and our depression measure had 9 items. To these measures, we added several questions about demographic variables and people's behavior in other contexts related to anxiety and depression such as sleep. This meant that we had dozens of survey elements that required grouped presentation.
Matrix questions share common response options and allow researchers to group similar questions together. For that reason, matrix questions are easier and faster for participants to answer than multiple items spread across several pages (e.g., Couper et al., 2001; Tourangeau et al., 2004). Presenting all items on one page may also improve their reliability (e.g., Couper et al., 2001). For all these reasons, matrix questions are appealing.
However, large matrices can cause participants to get tired or bored. Bored participants are more likely to drop out of the study, answer randomly, skip questions, or provide uniform answers, the behavior known as "straight-lining" (Iglesias et al., 2001; Toepoel et al., 2009). Depending on the platform, matrix questions can also display poorly on mobile devices (Revilla et al., 2017). Each of these issues can reduce data quality, so matrix questions should be used judiciously.
Standalone questions work better when each item requires careful consideration or has distinct response options (Debell et al., 2021). Single-item questions increase the likelihood that participants focus on one item at a time, and although single items may take longer for participants to complete, they reduce the risk of patterned responses (Roßmann et al., 2018). Single items also generally display better on mobile devices.
Research shows that participants prefer standalone questions, despite the longer completion time (Thorndike et al., 2009; Toepoel et al., 2009). Large matrices tend to correlate with lower response rates and more dissatisfaction among participants (Debell et al., 2021; Toepoel et al., 2009). This dissatisfaction comes from what some participants describe as "bubble hell" (Fowler et al., 2023). With many small "bubbles" displayed on the same page, participants can easily miss one or lose track of the answer options as they scroll down the page (Figure 13.9). Some survey features address these issues, but a large page of text is generally harder for participants to navigate than a single item.
Instead of large matrix questions, participants prefer approximately three items per page (Grandmont et al., 2010). They also prefer questions with a small to moderate number of response options (e.g., five or fewer), which prevents visual clutter (e.g., Fowler et al., 2023; Liu & Cernat, 2018). Both findings deserve consideration when designing a project, especially when matrices are necessary. For example, presenting all items from a lengthy measure like the BFI one at a time might be too tedious. Instead, a series of small matrix questions would be appropriate.
When matrix questions are necessary, there are ways to reduce the burden on participants. Some platforms let researchers repeat the answer option labels after every few rows in a matrix question, making it easier for participants to see which options correspond to each bubble. Some platforms also offer dynamic question features, such as graying out answered rows or highlighting missing answers, which can decrease missing data (Couper et al., 2013; Galesic et al., 2007). However, other interactive tools, such as highlighting rows when the mouse hovers over them, may actually increase missing data (e.g., Kaczmirek, 2011). Other options such as static shading of alternate rows or using background colors and typefaces to distinguish items appear to have no effect (Couper et al., 2013; Kaczmirek, 2008). In most cases, one of the most helpful features is requiring a response for each question, which nudges participants to provide an answer for items they might have accidentally skipped.
To apply this advice, consider a survey that measures anxiety and depression like the project in Chapter 4. The GAD-7 contains seven items measuring anxiety. Even though the measure is brief, there are several ways to present it. We could display all seven items on one page, as shown in Figure 13.10.
With this configuration, some participants may need to scroll to see all questions, depending on their device. The question text can also appear cramped, especially on mobile devices. Since this measure contains just seven items, breaking the matrix into separate questions on different pages makes sense. We could present between two and four items per page for optimal participant experience.
When questionnaires are long, deciding how many questions to present per page can be challenging. Our recommendation is that two to four items per page is ideal for most participants.
How Many Response Options?
When selecting the number of answer options, it is important to balance participant engagement, mental effort, and the precision needed in responses. A number that consistently balances these needs is five (e.g., Adelson et al., 2010; Donellan & Rakhshani, 2023; Rakhshani et al., 2023; Simms et al., 2019).
Five-option answer scales give participants room to express themselves without being overwhelming. When a project requires more nuance, a 7-point scale might be appropriate, but research shows little improvement in data quality with scales longer than 6 options (e.g., Simms et al., 2019). In other words, longer scales generally won't improve your results.
Related to the number of response options is whether to use an odd or even number of choices. This question has received significant attention because Likert scales with an odd number of options include a neutral middle point. Even when this middle option is not labeled, participants interpret it as a neutral position (Nadler et al., 2015; Kulas & Stachowski, 2009). In contrast, even-numbered scales have no middle point, which requires participants to lean one way or the other. Figure 13.11 illustrates this difference. The top scale forces people to either agree or disagree with the statement, while the bottom scale allows for a neutral response.
Consider omitting the middle point when the survey addresses familiar topics, when you are concerned about social desirability bias (Johns, 2005), or when participants might be uninvolved with the subject (Weems & Onwuegbyzie, 2001). Removing the middle option encourages participants to take a position. However, including a middle point is better when participants might genuinely hold neutral opinions, such as when the topic is unfamiliar (Johns, 2005). The survey's context will often help determine whether to include a neutral option.
The context should also guide your choice about the number of response options. If you are using a validated instrument like the GAD-7, this decision has been made for you. When creating your own questions, prioritize simplicity and clarity to keep participants engaged. Aim for 4 to 7 response options per question (see Chapter 4).
Regardless of how many response options you choose, maintaining consistency across questions helps participants understand and respond to the survey. Whenever the response scale changes, highlight this change through instructions or a visual break in the survey, often created with a page break.
When deciding on the appropriate number of response options, always consider your research goals and the mental effort required from participants as they move through the project.
Direction of Response Options
After deciding how many response options to include, researchers need to consider which direction the scale should run.
Traditionally, scales progress from positive to negative (i.e., agree to disagree). Many researchers believe this direction feels intuitive and easier for participants to understand. However, for that very reason, you might occasionally choose to run your scale from negative to positive (disagree to agree). This change can encourage more thoughtful engagement and reduce participants' tendency to acquiesce (e.g., Chyung et al., 2018; Garbarski et al., 2019).
Several factors influence how participants respond to questions. People tend to agree more with items presented early in a survey than items that appear later. They also agree more when answering questions with longer scales compared to shorter ones, and when responding to mixed questions rather than items that clearly measure one concept at a time (Yan et al., 2018).
Given these findings, it is best to use shorter answer scales and to measure one construct at a time rather than mixing different measures together. This approach helps maintain data quality regardless of scale direction.
Cultural factors may also affect how participants respond to survey questions. Not everyone reads from left to right, and what is considered 'intuitive' varies by culture. That means you should consider participants' cultural background when designing a survey, especially when collecting data internationally.
As with the number of response options, maintaining consistency in scale direction throughout the survey helps avoid participant confusion and improves data quality.
Vertical or Horizontal Answer Scales?
After determining the number and direction of answer options, you must consider alignment—whether the scale is presented vertically or horizontally (Figure 13.12). In terms of data quality, research suggests the answer to this question does not matter much.
Knowing that scale alignment has little impact on data quality (Chan, 1991; Friedman & Friedman, 1994; Hu 2020; Toepoel et al., 2009) means you are free to base this decision on factors such as readability, response accuracy, and the survey platform's capabilities rather than concerns about data quality.
Vertical alignment works better on mobile devices because it is easier to read on smaller screens. It also benefits surveys with lengthy questions or multiple-choice options by providing a clear view of all answer options, reducing mental effort for participants.
Horizontal alignment is more common on desktop computers and particularly suitable for matrix questions. Whichever format you choose, ensure all answer options are visible without requiring participants to scroll, as this could introduce response bias.
Understanding the target audience is important when choosing between vertical and horizontal alignment. The devices participants use vary significantly by recruitment source. In market research panels, approximately 50% of participants use mobile devices, with even higher rates in developing nations (Chandler et al., 2019; Moss et al., 2023). In contrast, less than 10% of participants on researcher-centric platforms typically use mobile devices (Chandler et al., 2019).
As with other aspects of survey design, maintaining consistency in alignment throughout the survey helps prevent confusion and increase participant engagement.
Open or Closed-Ended Items?
Given the many factors that can influence participant responses beyond the actual question content, you might wonder if open-ended questions would be more effective.
Open-ended and closed-ended questions serve different purposes in online surveys. Open-ended questions are particularly valuable when exploring new topics, investigating areas where the range of potential responses is not fully known, or seeking detailed, qualitative insights from participants (see Chapter 8). These questions allow participants to respond in their own words, which can reveal unexpected insights and perspectives that researchers might not have anticipated.
While open-ended questions provide valuable data, they present certain challenges. The responses can be complex and time-consuming to analyze, often requiring thematic analysis and coding to identify patterns (for a comprehensive look at qualitative research, see Yin, 2016). Additionally, since these questions demand more effort from participants, the quality of responses may vary considerably.
Closed-ended questions, conversely, are used to quantify opinions and behaviors. Their structured format facilitates straightforward comparisons between groups and across different time points. However, closed-ended questions constrain the range of responses available to participants.
The choice between open-ended and closed-ended questions should align with your research objectives. Open-ended questions are used for exploratory research and capturing the full spectrum of human experiences. Closed-ended questions are used for descriptive or experimental research where specific hypotheses are being tested.
Many effective surveys combine both question types, leveraging the efficiency of closed-ended questions and the depth of open-ended ones. Chapter 8 explains how AI tools are enabling researchers to conduct qualitative and mixed methods research at the scale of quantitative research, and the Engage platform specifically lowers the barrier to conducting open-ended responses by allowing participants to either type or speak their response using voice to text technology.
Other Survey Options
In addition to the features above, survey platforms possess several tools that do not need to be a part of every project but make certain projects more flexible and dynamic than offline ones. In most cases, these tools offer functionality that is not possible without technology.
Response Requirements and Question Validation
Earlier, we recommended creating no more than five questions per page throughout the survey to improve presentation and reduce missing data.
Most online platforms offer another tool for making sure that participants do not accidentally skip questions: response requirements. There are two basic types. One requests that participants answer overlooked items; the other forces participants to respond.
In our experience, requesting a response works better than forcing one. The request function reminds people about unanswered questions but allows them to proceed if they choose not to answer. Forcing responses prevents participants from moving forward until they have answered everything on the page, which might lead to inaccurate data if participants feel compelled to answer questions they prefer to skip.
Beyond response requirements, many platforms allow you to specify formats for participant responses, known as question validation.
Question validation ensures participants provide answers in a consistent format or within a specific range, which simplifies data analysis. For example, in the SpongeBath survey, we asked participants how much they would pay for the product. To avoid leading respondents, an open-ended question was ideal, allowing participants to answer without a suggestion from the researcher.
However, open-ended responses can be messy. Some participants might write "$20," others "20 bucks," and some simply "20." While these examples are easily converted to dollar values, other answers are more ambiguous. For instance, if asking about household income, an answer of "20" could mean $20,000 per year, $20 per hour, or something else.
Question validation prevents these issues by requiring answers to follow a specific format. While this makes data easier to analyze, overly restrictive requirements can frustrate participants. To avoid this, it is best to provide clear instructions and consider adding an optional comments section for clarifications. Always pilot test any custom validation added to your survey.
Piped Text
Survey platforms offer piped text (also called dynamic text) options that personalize the survey experience.
Piped text inserts content from various sources, such as previous responses, into subsequent questions or answer options. This works through a line of code that pulls information from other parts of the survey and displays it to participants.
You can use piped text to modify survey questions based on specific criteria like demographic information, responses to previous questions, or external data sources. When used effectively, piped text transforms a standard survey into an engaging, personalized research tool.
Timers
Online platforms make it possible to time participants. The most basic timing measure records how long people take to complete the survey. Those who finish a long survey very quickly probably ignored instructions or rushed through questions. Conversely, those who take an unusually long time on a short survey were likely distracted or stepped away.
The value of timers extends beyond tracking completion time. Researchers can embed timers that either: (a) ensure participants spend a minimum amount of time on a page, or (b) limit how long participants have before the survey automatically advances.
In one version of the SpongeBath study, we asked people to watch a short video. While we could not guarantee their attention, we increased the likelihood of people watching by preventing them from advancing until enough time had passed to view the entire video. In this way, timers can encourage engagement with study materials.
Timers can also create pressure. Some researchers study how cognitive processes differ when people have limited versus abundant time. In these studies, researchers might present a stimulus but give participants only a brief period to view it before automatically advancing the survey when time expires.
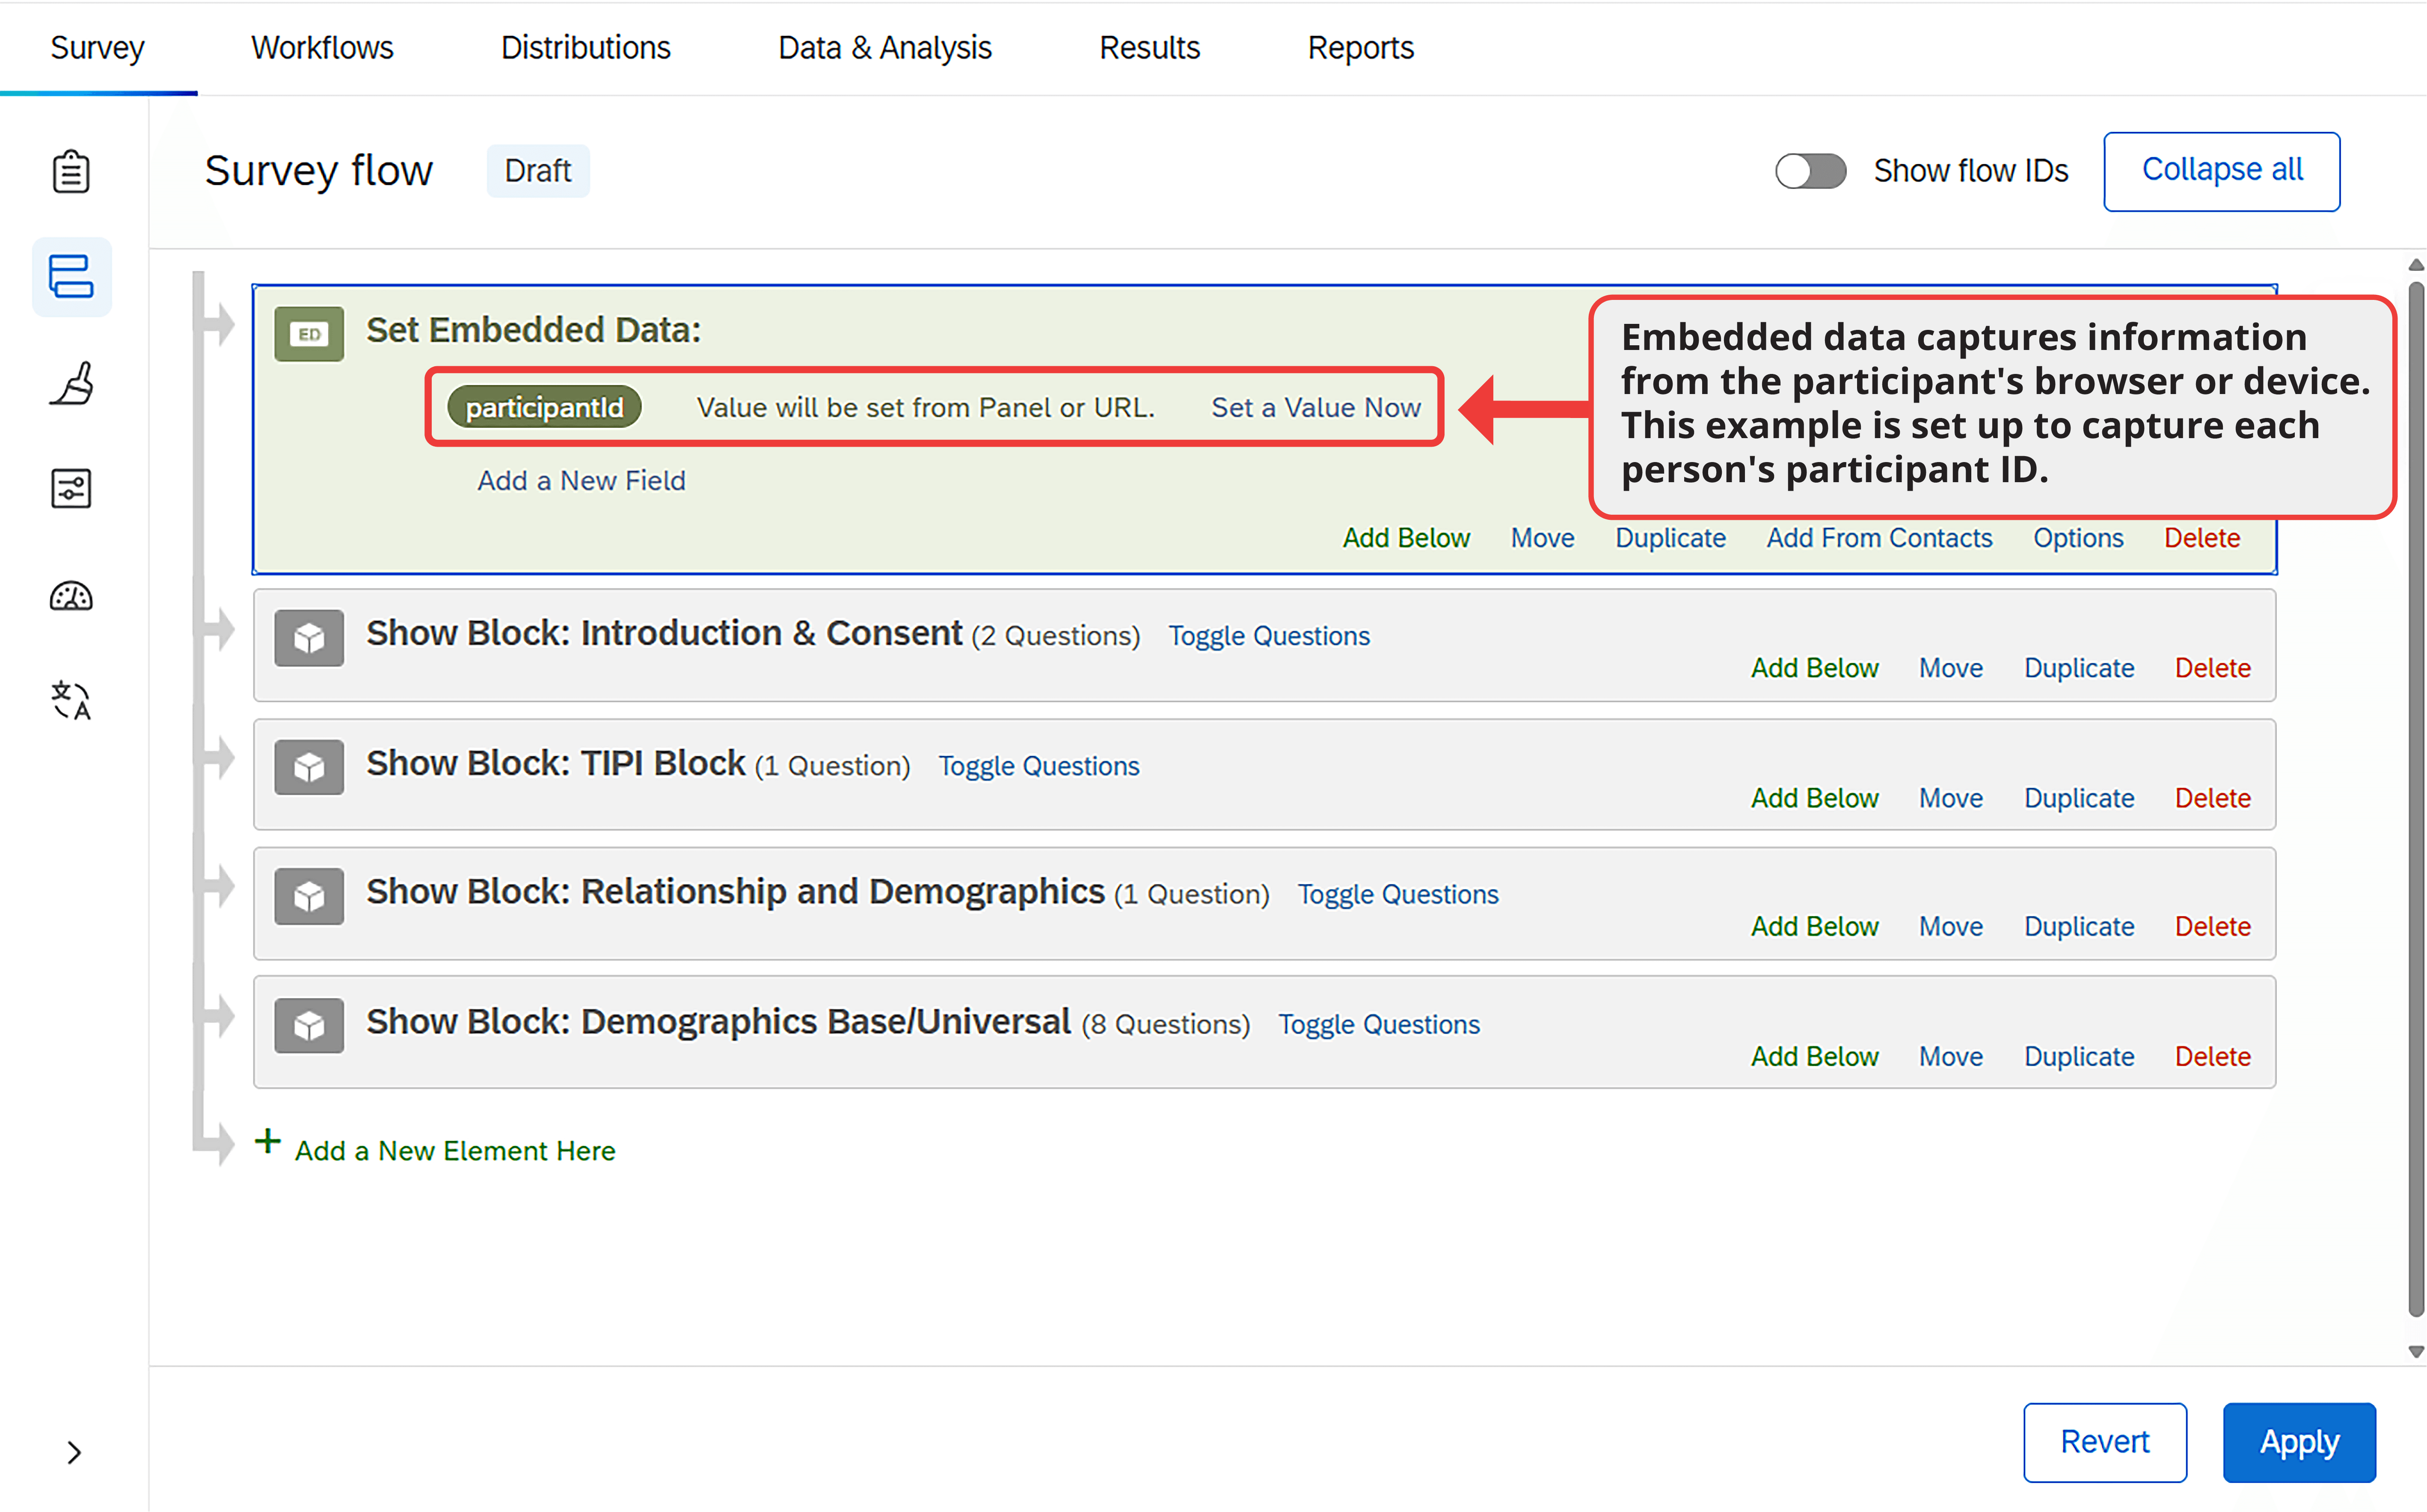
Embedded Data
Embedded data is information recorded about participants outside the traditional question and answer format. might include information about the webpage participants visited before entering the survey (sometimes used in marketing and consumer research), the experimental condition a participant was assigned to, calculated value based on other answers within the survey, or information captured from the participant's URL.
This last option helps researchers record each participant's unique ID within researcher-centric platforms, linking participation records from a recruitment platform like Connect to survey responses. To understand how this works, imagine a survey's URL is normally "https://www.example.com." Many recruitment platforms add values to this URL, such as: "https://www.example.com?participantId=ABCD1435&hitId=35hgfsbdu&assignmentId=vbwufg."
Using embedded data, a researcher can capture the additional values for storage in the data file. To capture the participant ID, the researcher would enter "participantId" in the appropriate field within the survey platform (Figure 13.13). The platform will then record this information during each participant's session.
Progress Indicators
Online surveys can display progress bars showing how far participants have progressed through the survey. Are these bars helpful?
On one hand, progress indicators make studies more engaging and might reduce dropout by showing participants how much of the project remains. They may also motivate participants by giving them a sense of momentum as they move through the study. On the other hand, it is easy to envision how participants may feel discouraged if they are not progressing through the survey quickly enough. If people get too discouraged, they may drop out rather than finish the study, or they may begin to rush lowering the quality of the data.
Progress bars do not significantly reduce drop off (Liu & Wronski, 2018; Villar et al., 2013) and have mixed effects on other aspects of data quality. While you may choose to include the progress indicator to inform participants about how much time they have left, you should not count on a progress indicator to deter participants from leaving the survey early.
End of Survey Options
Every survey must end, and there are multiple ways to program this conclusion. In some cases, a simple thank you message is sufficient.
When recruiting from paid sources, it is common to end with a redirect or completion code after debriefing participants. Both serve the same purpose: they confirm who completed the entire project.
Specific instructions for programming redirects or completion codes are usually provided by the recruitment platform. Typically, the researcher creates an end-of-survey element in the survey flow that directs participants who complete the project to a specific URL. Redirects are slightly easier for participants and more widely used, but completion codes work equally well.
Regardless of how your survey ends, include an option for participants to provide feedback about the survey itself. This feedback might clarify issues with participants' data or offer valuable suggestions for improving future surveys.
Estimating Survey Completion Time
Accurately estimating completion time is important for several reasons: it helps determine appropriate compensation, allows you to communicate honestly with participants (affecting their ability to plan participation), and prevents issues like dropout, rushing, or incomplete data that result from inaccurate time estimates.
Pilot testing provides the best estimate of completion times. Some recruitment platforms have built-in pilot systems that allow you to launch your project with a small number of participants before opening it fully. Without this option, you might ask friends or colleagues to complete your project. For accurate estimates, these testers should be unfamiliar with your measures and should approach the project as actual participants would.
When pilot testing is not possible, estimate survey length by allowing about 10 seconds per question (Litman & Robinson, 2020). Multiplying your total question count by 10 provides a rough estimate of completion time in seconds.
Summary
Online survey platforms have become essential tools in modern behavioral science. They empower researchers to create dynamic projects, distribute surveys and experiments across the internet, and collect quality data from participants worldwide.
Designing effective and engaging online surveys requires understanding the tools discussed throughout this chapter. These include the various survey elements available to present to participants, how to select appropriate questions and organize them into blocks, how to optimize question presentation on screen, and when to implement advanced features such as randomization, skip logic, branching, page timers, and end-of-study options. With this foundation, you can evaluate the programming of the guided research projects presented earlier in this book. You should recognize how each study incorporates the principles outlined in this chapter to ensure high-quality data collection from a design perspective.
Despite careful planning, there may be times when the guidelines presented here are not suited to your specific project or participant pool. Human behavior can be unpredictable, and research does not always proceed as anticipated. To address this uncertainty, pilot testing is invaluable. The feedback gathered during testing can significantly improve your survey before full data collection. In the next chapter, we will learn about conducting effective pilot tests and how to set up you're a project to gather data with a participant recruitment platform.
Frequently Asked Questions
What is a survey platform and what does it do?
A survey platform is a digital toolbox that allows users to create customized questionnaires, distribute projects, and collect data efficiently. Survey platforms have transformed data collection in the behavioral sciences by making powerful tools accessible to anyone who can use a point-and-click interface, without requiring technical knowledge or advanced programming skills.
What is the optimal number of response options for survey questions?
Research consistently shows that five response options provide a good balance between participant engagement, mental effort, and precision in responses. When a project requires more nuance, a 7-point scale might be appropriate, but research shows little improvement in data quality with scales longer than 6 options.
Should I use matrix questions or standalone items in my survey?
Matrix questions are easier and faster for participants to answer than multiple items spread across several pages and may improve reliability. However, large matrices can cause fatigue, leading to dropout, random answers, or straight-lining. Research shows participants prefer approximately three items per page. Standalone questions work better when items require careful consideration or have distinct response options.
What is the difference between between-subjects and within-subjects randomization?
In between-subjects randomization, each participant sees just one block beneath the randomizer and is randomly assigned to one experimental condition. In within-subjects randomization (used for counterbalancing and repeated measures), participants see all blocks but in a random order determined for each participant, which helps prevent order effects from explaining associations between constructs.
How can I estimate survey completion time?
Pilot testing provides the best estimate of completion times. When pilot testing is not possible, estimate survey length by allowing about 10 seconds per question. Multiplying your total question count by 10 provides a rough estimate of completion time in seconds. Accurate time estimates help determine appropriate compensation and prevent issues like dropout or rushing.
Key Takeaways
- Survey platforms are digital toolboxes that allow researchers to create questionnaires, distribute projects, and collect data efficiently without requiring advanced programming skills
- Survey elements are the basic building blocks of online studies, including instructions, images, videos, multiple choice questions, open-ended items, ranking questions, drag-and-drop items, heat maps, and sliders
- Question blocks help organize survey elements, enabling randomization and branching logic that customize each participant's experience
- Between-subjects randomization assigns each participant to one condition, while within-subjects randomization presents all conditions in random order to prevent order effects
- Matrix questions are faster to complete but can cause fatigue; participants prefer approximately three items per page
- Five response options consistently balance participant engagement, mental effort, and precision; longer scales show little improvement in data quality
- Vertical alignment works better on mobile devices, while horizontal alignment is more common on desktop computers
- Open-ended questions are valuable for exploration and qualitative insights; closed-ended questions are better for quantifying opinions and testing hypotheses
- Response requirements that request (rather than force) answers work better for reducing missing data without frustrating participants
- Piped text, timers, and embedded data add flexibility and personalization to online surveys
- Pilot testing provides the best estimate of completion times; without it, estimate about 10 seconds per question